Blog
All Blog Posts | Next Post | Previous Post

 Extend TMS WEB Core with JS Libraries with Andrew:
Web Audio API Part 2 of 2
Bookmarks:
Tuesday, October 4, 2022

In the first of our pair of Web Audio API posts (which can be viewed here), we used TMS WEB Core to create a functional music player app, including a visualizer created with D3 Charts (a JavaScript charting library we first covered in this post), and a playlist created with Tabulator (a JavaScript table/data grid library we covered in a series of seven blog posts, starting with this one). We also employed an additional JavaScript library, jsmediatags,to help with reading metadata from whatever music files were loaded into the player, such as the song, artist, and cover art from an .MP3 file.
As far as the Web Audio API was concerned, we created a simple AudioGraph that just connected an AudioBufferSourceNode to an AudioGainNode to play back music tracks, with a master volume control. We then put all the JavaScript code into its own unit, WebAudioAPIHelper.pas, so that it would be less work to create audio apps with different user interfaces. Overall, this involved a lot of little pieces that were ultimately combined to produce something familiar - a typical music "Player" app.
This time out, we're going to do pretty much the same sort of thing, but with the goal of using TMS WEB Core to create a music editor app, referred to here as the TrackEditor. Something along the lines of a basic GarageBand-style app rather than a basic WinAmp-style app like last time.
We'll be
extending the WebAudioAPIHelper.pas unit with more JavaScript code, with the same goal of keeping the main project
unit JavaScript-free. We'll be calling on some earlier JavaScript libraries that we've already covered to help
with a handful of interesting UI challenges that need to be solved along the way. And, naturally, we'll be going
further into the Web Audio API itself, using more AudioNodes and constructing a considerably more complex
AudioGraph.
Motivation.
Just like last time, we're on a bit of a continuing Web Audio API mission suggested by TMS WEB Core user David Schwartz, and we barely scratched the surface last time. So much yet to explore. And for those not particularly interested in the Web Audio API, there are some seemingly unrelated challenges to be found here that, at first glance, might seem well beyond something that could be covered in a blog post. But I do like puzzles! So let's get started.
The Same, But Different.
To begin with, we're going to largely be starting where we left off previously, conceptually at least. So do have a look at the first post if you've not yet had a chance, as we'll be building heavily on top of some of those topics here. For example, we're going to be starting with the development of the user interface in the same way - a sort of mockup that we can then populate with the necessary bits and pieces as we go. We'll need a place for a track list, and lots of places for buttons and other things, including the visualizer. So let's start with something like this.
Beginnings of the TrackEditor.
The main track list will be constructed using Tabulator, just as we did last time. In this case, though, we'd really like to show the waveform for the audio track alongside the cover art and title/artist/album information. When an audio file is loaded, we get the raw data ultimately from the Web Audio API's decodeAudioData() function. Using D3, we can then generate an SVG element and store it in Tabulator, ready to be displayed.
And we can be as fancy as we like here. So let's show separate channels in the waveform, just using the absolute value of each as the height of the bar graph, with one bar graph pointing up and one pointing down. Easier to see than to explain. Here's the code we're going to use (JavaScript). In this case, we know we want the chart to be a certain height to fit into the table cell, and we're calculating a width based on 5 pixels/second (which we'll explore in more detail a little bit later).
    const detachedSVG = d3.create("svg");
    var w = 0;
    var h = 52;
    // Lets see if we can get a graph showing the entire clip
    const dataArray = TrackData.jsarraybuffer.slice(0);
    await this.AudioCtx.decodeAudioData(
      dataArray,
      (buffer) => {
        w = buffer.duration * 5.0;

        const step = Math.floor(
          buffer.getChannelData(0).length / w
        );

        const samplesL = [];
        for (let i = 0; i < w; i++) {
          samplesL.push(buffer.getChannelData(0)[i * step]);
        }
        const samplesR = [];
        for (let i = 0; i < w; i++) {
          samplesR.push(buffer.getChannelData(1)[i * step]);
        }

        detachedSVG.attr("width", w)
                  .attr("height", h);

        const dataL = Array.from(samplesL.entries());
        const dataR = Array.from(samplesR.entries());

        const xValue = d => d[0];
        const yValue = d => d[1];

        const xScale = d3
          .scaleLinear()
          .domain([0, dataL.length - 1])
          .range([0, w]);

        // Draw Channel 0
        detachedSVG.selectAll('.ch0')
          .data(dataL)
          .enter()
          .append('rect')
            .attr('width', ((w / dataL.length) * 0.8))
            .attr('height', function (d) { return Math.abs(yValue(d) * 24)})
            .attr('x', function (d, i) { return (((w / dataL.length) * i) + ((w / dataL.length) * 0.1)) })
            .attr('y', function (d) { return 25 - Math.abs(yValue(d) * 24)})
            .attr('fill', '#fff');

        // Draw Channel 1
        detachedSVG.selectAll('.ch1')
          .data(dataR)
          .enter()
          .append('rect')
            .attr('width', ((w / dataL.length) * 0.8))
            .attr('height', function (d) { return Math.abs(yValue(d) * 24) })
            .attr('x', function (d, i) { return (((w / dataL.length) * i) + ((w / dataL.length) * 0.1)) })
            .attr('y', 25)
            .attr('fill', '#fff')
      },
       (e) => {
        console.log("Error decoding audio data: "+e.error);
      }
    );
This is an example of what it looks like.

Waveform created using D3.
If you wanted to have a line between the two channels, the bottom chart could be shifted down a pixel by adjusting
the ".attr('y',25)" to ".attr('y',26)" in that last chunk of D3 code. This would create the following look.

Waveform created using D3 - Adjusted.
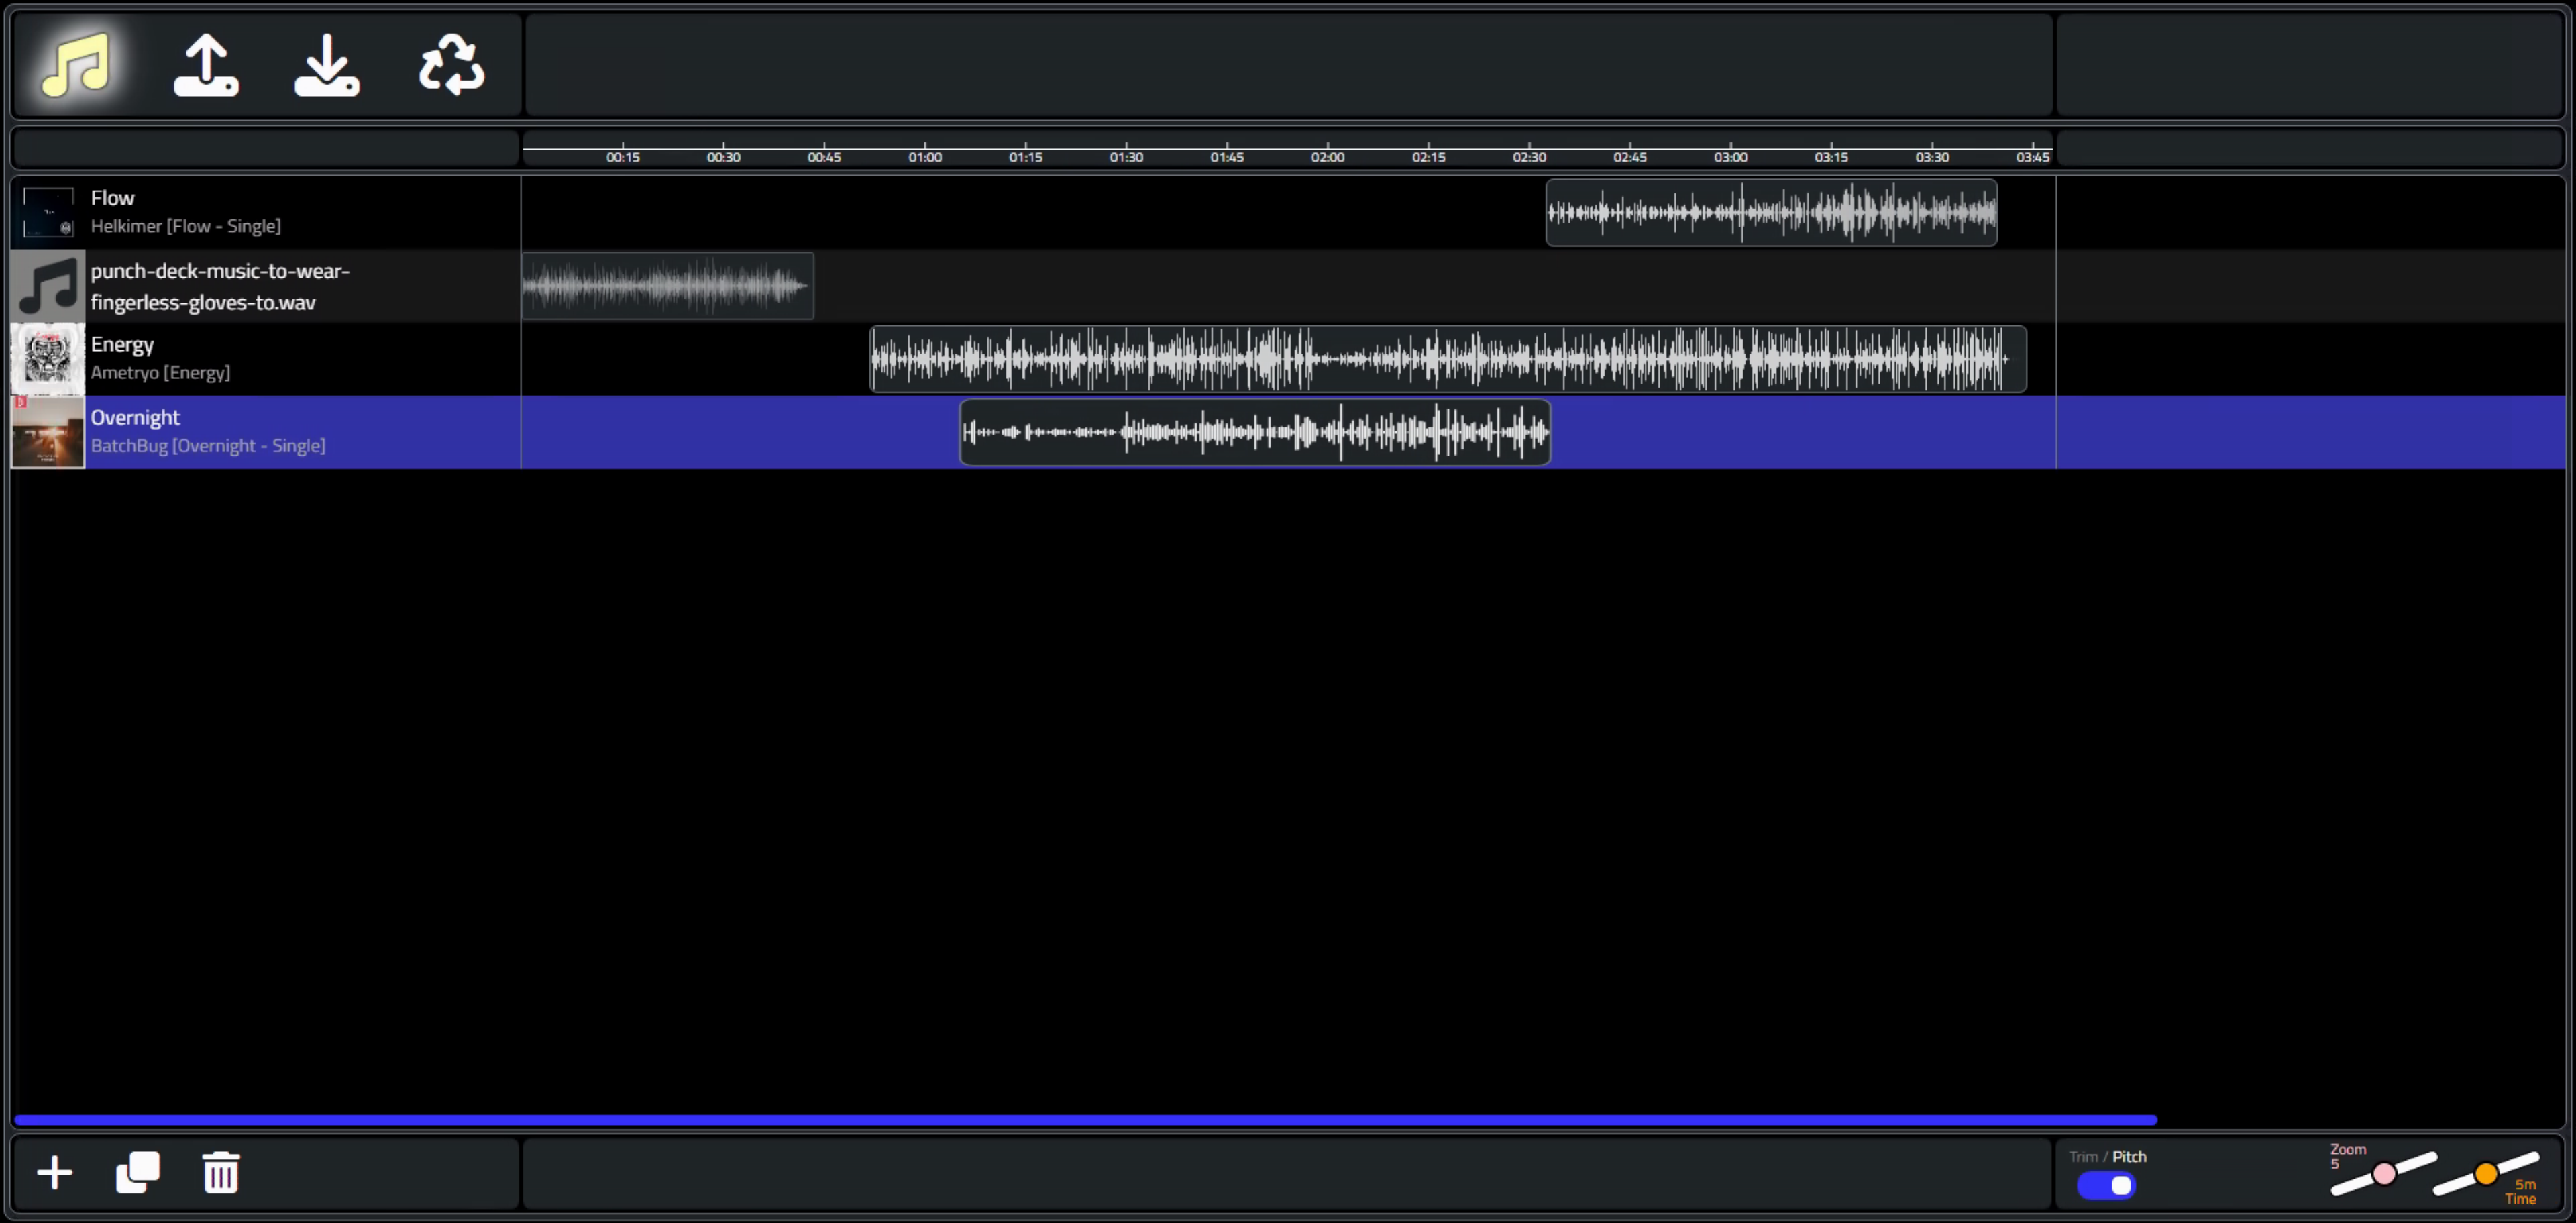
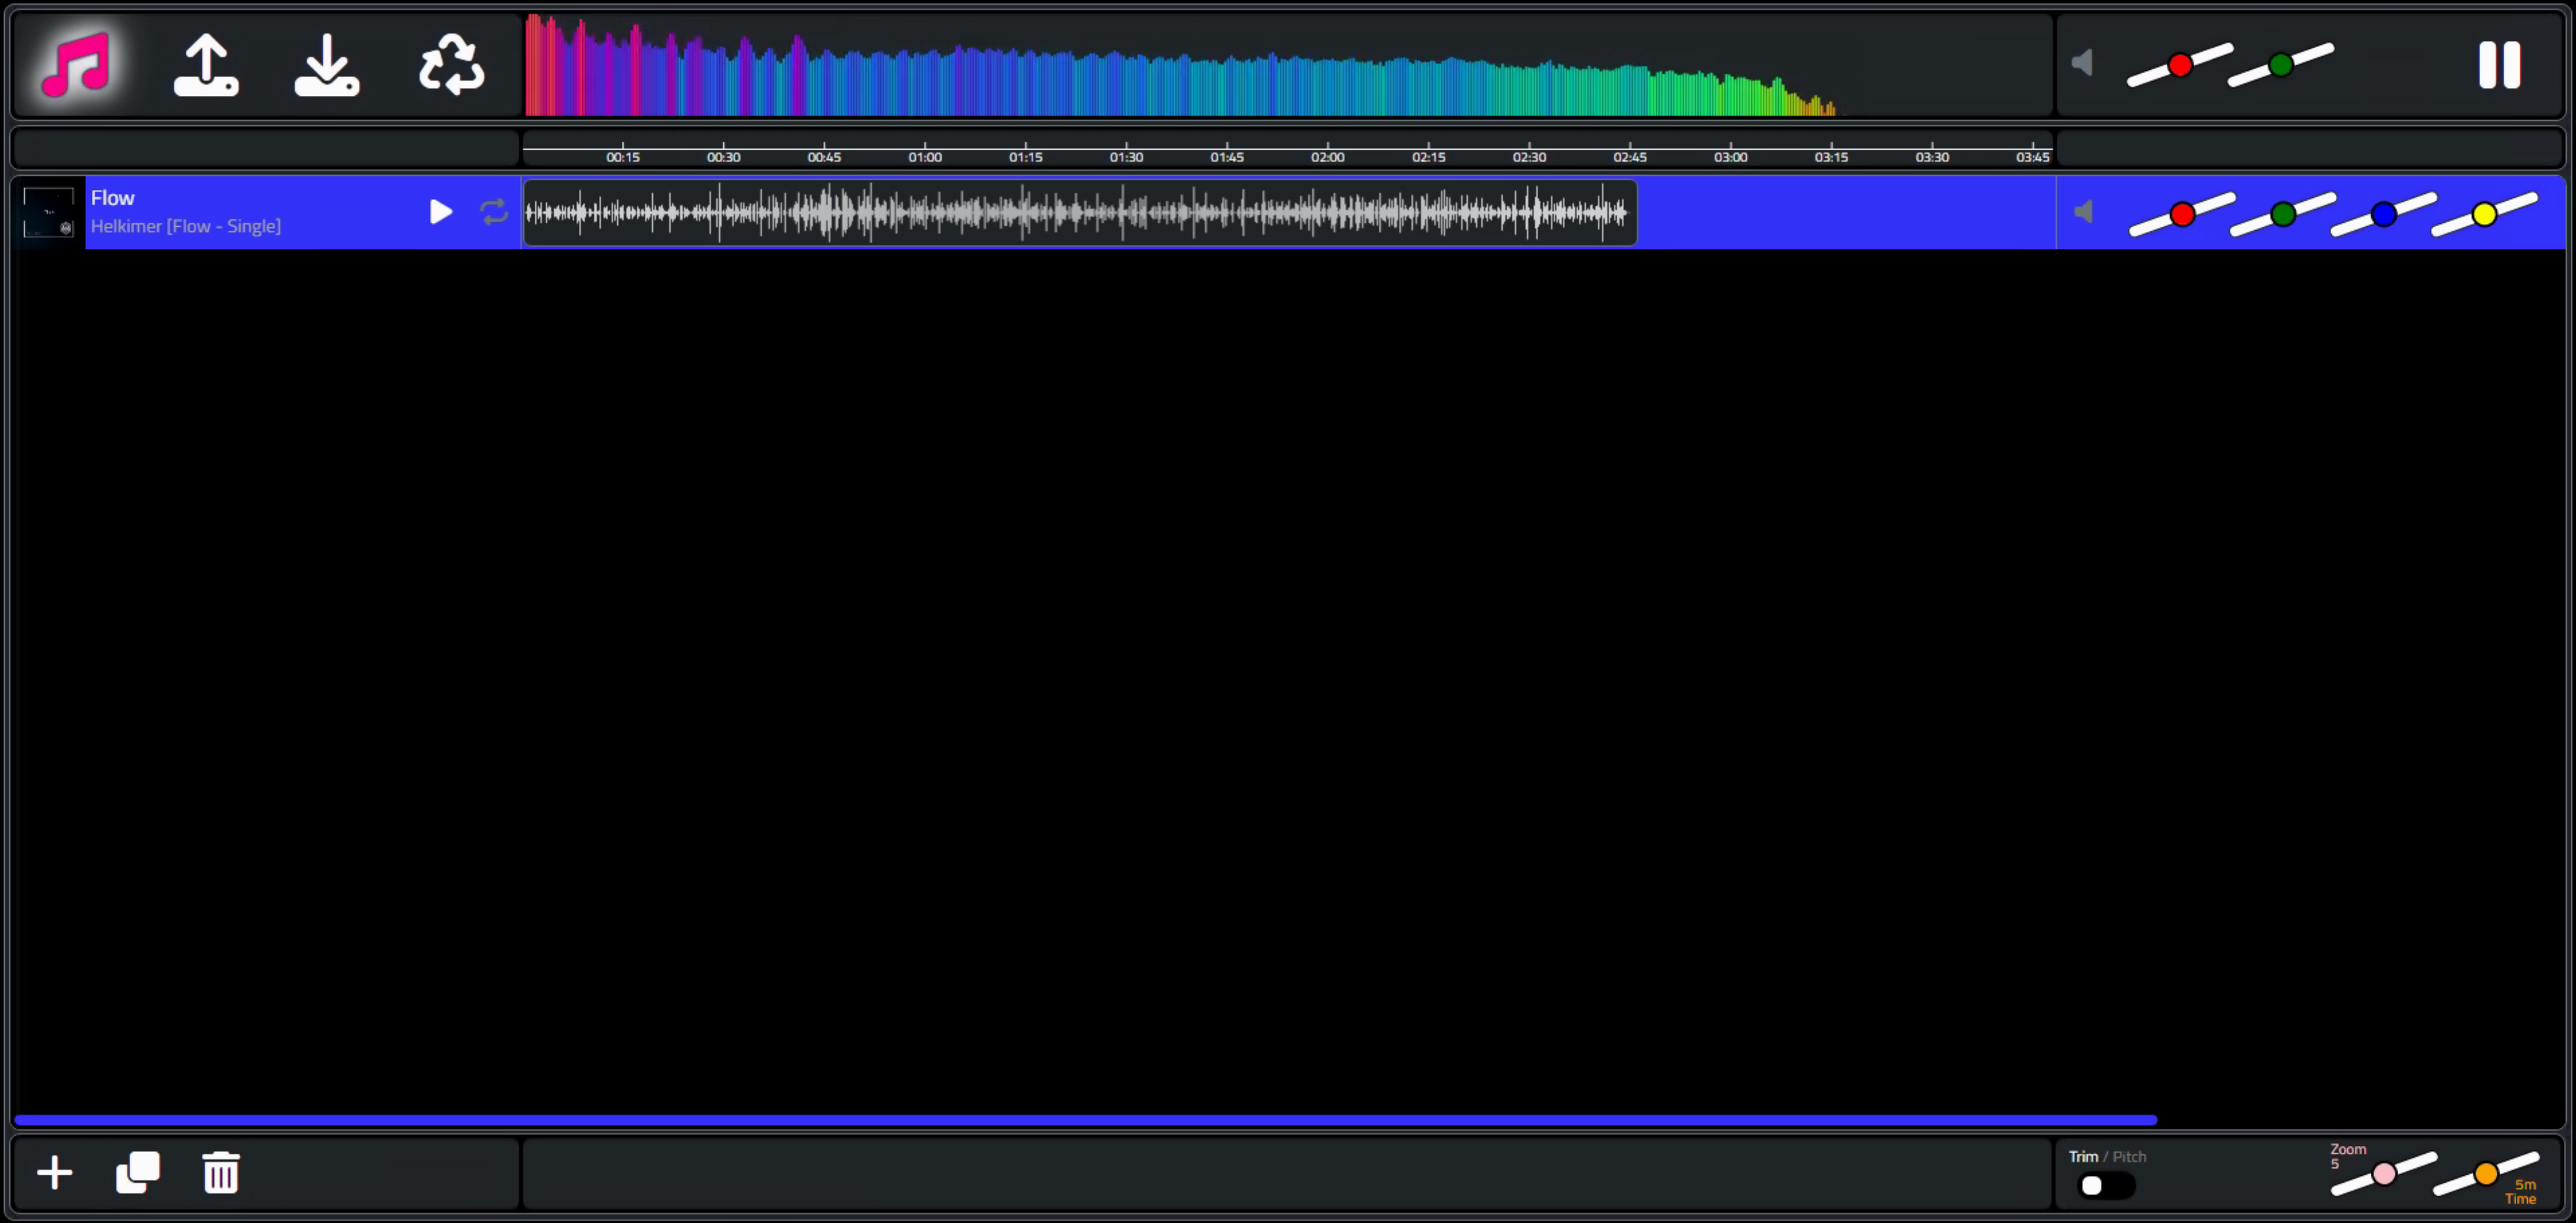
The main takeaway here is that D3 is an incredibly powerful tool. And very fast, as well. Once we have our SVG element, it can be passed around and manipulated just as easily as any other element. If we add a few buttons to the overall TrackeEditor UI that are functionally equivalent to what we did in the Player app, dealing primarily with loading audio files, our UI now looks more like this.
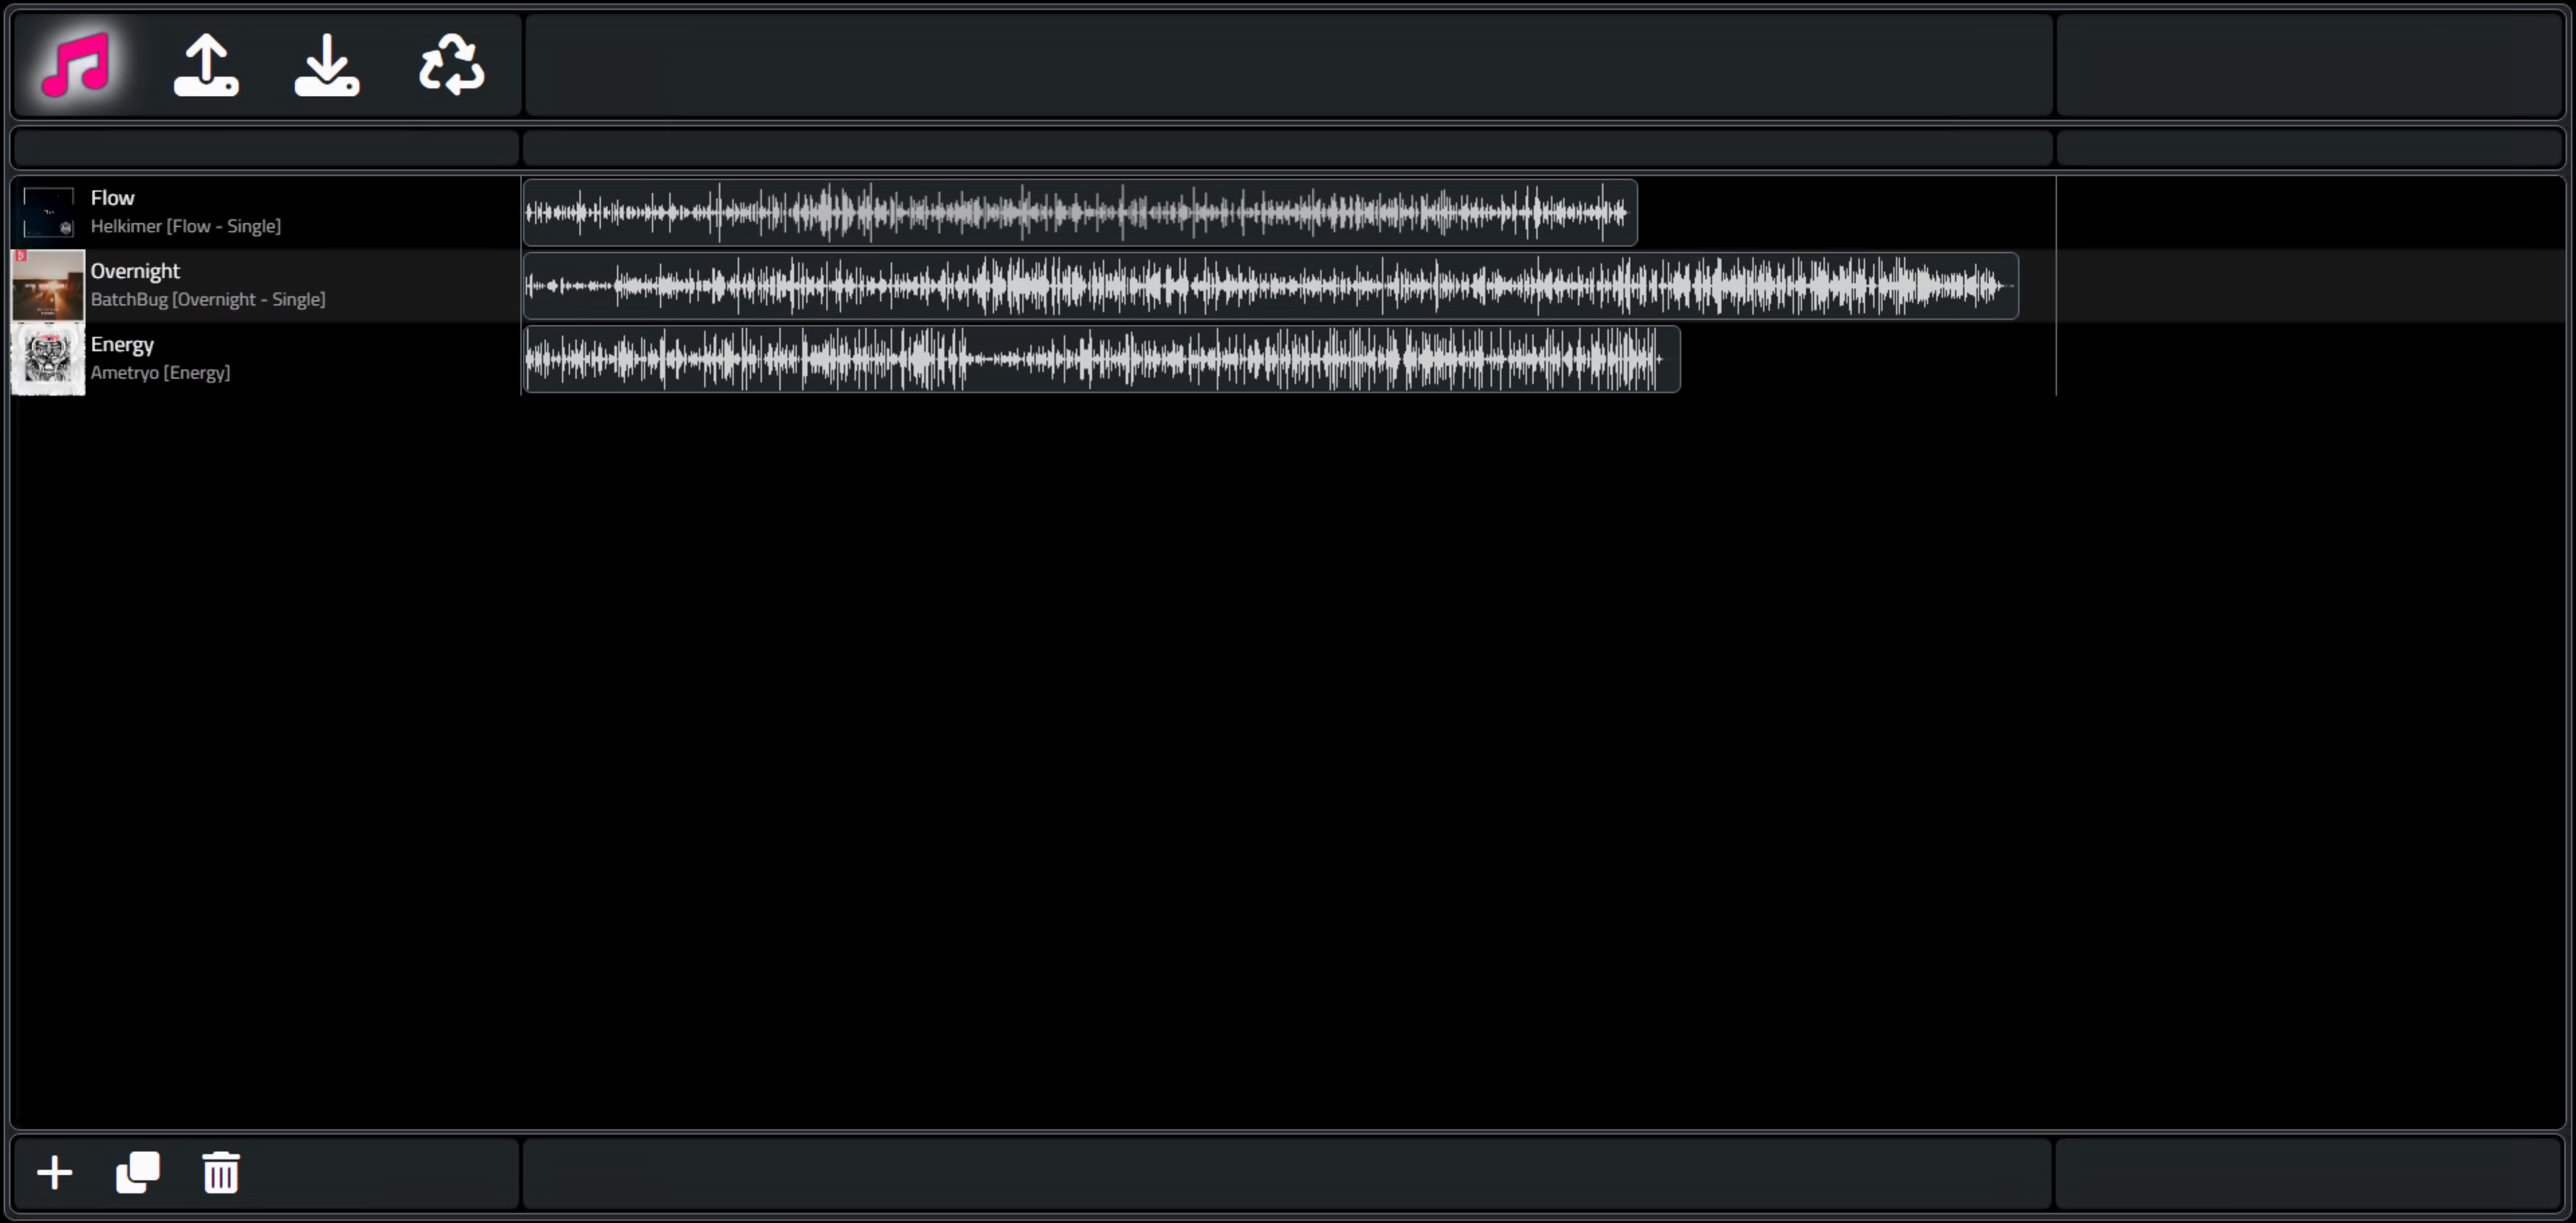
TrackEditor With Sample Tracks Loaded.
A few additional notes before moving on.
- TWebOpenDialog can be supplied with a list of supported file extensions, or in our case, "audio/*" is likely
the best option. Something I wasn't aware of when working on the Player app.
- In addition to adding and removing tracks, we also have a new "clone" option, not something that was needed in the Player app.
- Track order can still be changed. There are too many other UI interactions in the other columns of the table, so while the Player app could support dragging tracks up and down anywhere in the row, here this functionality is limited to just the first column - drag the cover art (or icon) up or down to change the track order.
It is already starting to take a familiar form.
Time is of the essence.
In the Player example, we didn't care too much about time. There was a scrubber to show and adjust the current track position, and a display for time elapsed/remaining, and everything was coordinated based on the time the AudioContext object was created, behind the scenes. So we cared a little bit.
In this TrackEditor example, time has a far greater significance. We'll want to display a proper timeline and be able to make a variety of time-related adjustments to individual tracks. We'll also need to have some flexibility in how time is displayed, keeping in mind the available display space in the interface, the overall time duration of the project, and other factors.
Let's start with the timeline. Here, we'll want to see what amounts to the same thing as a time-based chart axis, starting at 00:00 and ending sometime later. D3 to the rescue again. We'll be making adjustments to this later, but initially, we can draw a time axis using the following.
Note that this works with the latest version of D3. There are plenty of examples of D3 code for doing time-based things, but be careful of the version, as this is something that was overhauled in D3 relatively recently, so many of the examples are now out of date. Here we're using UTC time. D3 tries perhaps a little too hard to be accommodating with dates and times, so we'll have to forcibly tamp it down a bit, even going so far as having to remove the first element of the axis that is generated.
procedure TWAAH.DrawTimeline(PixelsPerSecond: Integer; TimelineSeconds: Integer; TimelineDiv: String);
begin
  // First, let's draw a new timeline D3 chart at the top
  asm
    var TimelineElement = '#'+TimelineDiv;
    var TimelineWidth = PixelsPerSecond * TimelineSeconds;
    var TickFrequency = 30;
    switch (PixelsPerSecond) {
      case 9: TickFrequency =   5; break;
      case 8: TickFrequency =   5; break;
      case 7: TickFrequency =  10; break;
      case 6: TickFrequency =  10; break;
      case 5: TickFrequency =  15; break;
      case 4: TickFrequency =  15; break;
      case 3: TickFrequency =  30; break;
      case 2: TickFrequency =  30; break;
      case 1: TickFrequency =  60; break;
    }

    // Delete any prior svg element
    d3.select(TimelineElement)
      .selectAll("svg")
      .remove();

   // Create svg element
    var svg = d3.select(TimelineElement)
                .append("svg")
                .attr("width", TimelineWidth);

    // Create time scale starting at 00:00
    var x = d3.scaleUtc()
              .domain([0, TimelineSeconds * 1000])
              .range([-1, TimelineWidth]);

    // Draw the axis
    svg.append("g")
       .attr("transform", "translate(0,14)")      // This controls the vertical position of the Axis
       .attr("class","axis")
       .call(d3.axisBottom(x)
             .tickSize(-5)
             .tickFormat(d3.timeFormat("%M:%S"))
             .ticks(d3.timeSecond.every(TickFrequency)));

    // Remove the very first tick
    d3.select(".tick").remove();

    // Note: color of axis is set via CSS .axis selector

    // Set column width in Tabulator to match the Timeline
    this.tabTracklist.getColumn('WAVEFORM').setWidth(TimelineWidth);

  end;
end;
There are a few other things going on here that we'll get to in just a moment. But the essence of this is that we're drawing a timeline based ultimately on a parameter of "pixels per second", for a specified duration, into a particular <div> element. By default, we'll use 5 pixels/second, and a duration of 5 minutes (300 seconds). This gets us a timeline that looks like the following, clipped due to the display area not being wide enough to show the full range.

Default Timeline.
The number of ticks and their format can be readily altered, and this is done when the time scale changes (the pixels per second parameter). We've set some defaults here, based on having a pixels per second value ranging from 1 to 9, but this could be extended on either end to allow for either higher precision projects (maybe only a few seconds long) or longer duration projects (an hour or more) or even both.
The idea is to make it possible to display both the entire project in one view, not clipped, and to also make it possible to show the part of the project you're focused on, in enough detail to make fine adjustments. To do this, we'll be adding a timeline "zoom" control shortly. We'll also need to be able to shift the timeline and the resulting track view together, to focus on different parts of the project. But to do that, we'll first need to have a way to move things in our interface.
Let's Move.
If you've been following this "Extend TMS WEB Core with JavaScript Libraries" blog series from the start, you might recall that we covered the InteractJS library fairly early on. If you haven't, then it might be helpful to check it out here. The short version is that this library makes it possible to add drag and resize functionality to any element just by assigning a particular CSS class to that element.
The specific behavior (and class names) can be customized in various ways. For example, perhaps some elements only need to be dragged. Or some might be resizable, but only in one dimension. When an operation is performed, events are fired that can, in turn, call back to Delphi functions if necessary.
This is a library that has an active developer presence and seems to be evolving in other interesting ways as well. To add it to our project, the usual Project.html can be added, or by the alternate method using the Manage JavaScript Libraries feature in the Delphi IDE.
<script src="https://cdn.jsdelivr.net/npm/interactjs/dist/interact.min.js"></script>
In order to make the most of this particular JavaScript library, it is going to be important to understand what it is actually doing, and some of its design choices are indeed curious. For example, when applied to a <div>, any dragging deliberately does not change the <div>'s regular attributes like top, or left. It specifically leaves those untouched. So for many purposes, the changes are largely unnoticed - the original <div> appears to be unchanged. Except for, of course, the fact that it has been dragged.
Instead, it uses the CSS transform property to adjust the X and/or Y values based on the dragging that was performed. When a dragging operation is detected, an event is fired which indicates a DeltaX and DeltaY value of the movement. This is then added to whatever prior DeltaX or DeltaY value was previously recorded, and the transform property is updated accordingly. The prior values are stored as data attributes directly in the element - specifically "data-x" and "data-y".
This all works pretty well, and the event that does the work is explicitly laid out in code, so we can do whatever we want. For example, if we didn't want it to work that way, but rather just update the top and left values explicitly, we could do that. We'll be doing a few interesting things here in a little bit. But before we do that, we've got yet another little rabbit hole to go down.
Sidebar: Sliding Bars.
In the Player app, we had a couple of instances of what Delphi refers to as a trackbar control, one for the volume control and one for the player position. In HTML this is referred to as a range slider. And in that project, we ended up using the TTMSFNCTrackbar component as the TWebTrackbar component wasn't as easy to modify style-wise.
The default look and feel of an HTML range slider isn't particularly attractive, but it is reasonably functional. The TWebTrackbar closely mimics this, naturally, because that's what is generated when the TMS WEB Core project is compiled. Customizing an HTML range slider (and thus the TWebTrackbar component) using CSS and JavaScript is entirely possible, and there are many online tutorials that cover how to do just that.
The problem, really, is that it isn't all that easy and there are more than a fair few browser-specific implementation details to worry about, making a bad situation worse. The TTMSFNCTrackbar component gets around this by just drawing a <canvas> element, and it has plenty of properties to make attractive range sliders with many advanced properties. All good for our Player example.
But, as we've already got our InteractJS library loaded up, we can very quickly and easily build a bespoke range slider of our own that is much simpler (aka performant) and does exactly what we need, no more and no less. Now, to be completely honest, this is entirely unnecessary from a technical point of view, as the existing trackbar and range slider options are readily available and easy to use. However, as this is an example blog post, it is an opportunity perhaps to experiment a little bit, try out different ideas, and see what works and what doesn't. In our case here, we're going to quickly run into a situation where we have a lot of range sliders visible in the UI at the same time. Simplicity is the order of the day.
Also, we're going to run into a situation where we want to display a bunch of these in a rather small amount of space, specifically a short and wide rectangular space - a table cell. If we display range sliders vertically, we'll not have much room for many "steps" in the movement, making it a bit harder to use (particularly with a touch interface), and we'd end up with lots of wasted space between them.
If we display range sliders horizontally, we'll
also not have much room for many "steps" and we'll still have lots of wasted space below and above them. The solution? Let's
try displaying them on an angle. So we get a larger range of motion for the slider itself, and they can 'overlap'
in a sense to make better use of the available space. But that's a lot of words where a picture might be better. Here's the HTML code for our bespoke range slider.
<div class="CusomTrackbar" title="Zoom" style="position:absolute; transform:rotate(-20deg); left:5px; width:100px; height:20px; top:17px;">
  <div class="rounded border bg-white" style="border-color: #000 !important; position:absolute; width:86px; height:10px; top:5px; left:7px"></div>
  <div id="trackerZoom"
          class="draggableTrackbar rounded-pill border border-2"
          style="cursor:nesw-resize; border-color:#000 !important; background-color: pink; position:absolute; width: 20px; height: 20px; top: 0px;
left:0px;transform:translate(40px,0px)"
          data-x="40">
  </div>
</div>
The outer <div> defines the rotation, a hint, and the rough dimensions. Within that is a blank bar that is fitted to the <div> in specific dimensions. And on top of that, we've got the thumb of the range slider, which we'll control with InteractJS. It also has specific dimensions and is "pre-loaded" to have the appropriate transform and "data-x" attribute to have the thumb in the middle position. The rotation is set at 20deg and the thumb is assigned a color.
Nothing really fancy here, just a very simple range slider. This could most certainly be extended or improved in countless ways. For example, adding a value to the thumb, or ticks, or filling one side of the background bar. But we're after simplicity and consistency a the moment. Here's what it looks like.
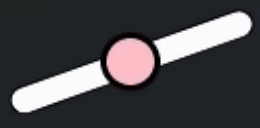
Bespoke Trackbar / Range Slider.
What we're interested in, in terms of range values, is just a number between 1 and 9 inclusive (and defaulting to
5). It turns out that this same range will work pretty well for virtually all of our needs. Basically a middle
(default) value, and four steps up and down (or left and right) from there.
In the definition above, we've added
the "draggableTrackbar" class to the thumb in the middle. The code to implement this particular range is not
necessarily the most friendly, but it works pretty well. Note that typically the value of X will be somewhere in
the range of 0.0 and 80.0, which then ultimately gets mapped to an integer value of between 1 and 9.
     function draggableTrackbarListener (event) {
      var target = event.target;
      var oldx = parseFloat(target.getAttribute('data-x')) || 0;
      var offx = event.dx;
      var newx = (10*Math.ceil(oldx/10))+(10*Math.ceil(offx/10));
      if (newx <  0) {newx =  0}
      if (newx > 80) {newx = 80}
      target.style.transform = 'translate(' + newx + 'px, 0px)'
      target.setAttribute('data-x', newx)

      switch(String(target.id)) {
        case "trackerZoom": pas.Unit1.Form1.trackerZoomChanged(1 + parseInt(newx / 10)); break;
      }
    }
    window.draggableTrackbarListener = draggableTrackbarListener

    interact('.draggableTrackbar')
      .styleCursor(false)
      .draggable({
        modifiers: [
          interact.modifiers.snap({
            targets: [
             { x: 10, y: 0 },
             { x: 20, y: 0 },
             { x: 30, y: 0 },
             { x: 40, y: 0 },
             { x: 50, y: 0 },
             { x: 60, y: 0 },
             { x: 70, y: 0 },
             { x: 80, y: 0 },
             { x: 90, y: 0 }
            ],
            offset: 'parent'
          })
        ],
        listeners: {
          move: draggableTrackbarListener
      }})
The code should be easy enough to decipher. We're just watching for changes in the X value, which works well with the particular rotation we've got. If we wanted a slider that was more vertical in its orientation, we could rearrange things and use the Y values instead, but this works fine as it is.
The InteractJS library has a whole host of ways to "snap" any kind of movement, with extensive documentation and examples on their website. Here, we're using a set of specific targets to ensure we end up at a value that we like and further ensuring this by rounding everything we deal with coming back from the event. The end result is a switch statement (the JavaScript equivalent of a Delphi case statement) where we can fire off a separate Delphi function call for each of the sliders we've got.
There are no doubt many other ways to do this, but this works pretty well and frees us up to get back to other parts of the TrackEditor application. We'll start with having a range slider for the timeline zoom function (which is what is defined above) as well as one for determining the project window - how many minutes long the project is. For the zoom function, we'll use the 1-9 range as the actual "pixels per second" value directly.
For the project duration, we'll use the 1-9 range as the number of minutes of the project. Both of these ranges could be mapped to entirely different values. We'll see several examples of that kind of thing very shortly. In just these two sliders, we'll also display the selected value in the Delphi callback function, which then shows the values in the UI.
The DrawTimeline function already anticipated these values, so no extra work there, really. However, we also need to apply the same scaling to the column in the table that displays the waveform. The width of the column can be set to the width of the timeline that is drawn, which we're already doing. But we also need to scale the <div> that is displayed to account for this change in the timeline scale.
Note carefully that we have to be mindful of where and when to apply our own CSS transforms so that we don't bump into the CSS transforms that are being applied by the InteractJS library. In this case, the waveform is an SVG that is wrapped in a <div> which itself is wrapped in another <div> that represents the full size of the cell in the table (which itself is yet another <div> in the hierarchy).
We want to apply this new scale at the level just below the
cell <div> defined by the table. Applying a transform property to adjust the scale also needs to take
into account where the scaling is calculated from - its origin. By default, it is the center of the element. We'll need to
adjust that so that it is from the left. Here's what the code looks like.
    // Adjust waveform scale to match timeline
    var rows = this.tabTracklist.getRows();
    for (var i = 0; i < rows.length; i++) {
      rows[i].getCell('WAVEFORM').getElement().firstElementChild.style.transformOrigin = '0px 0px';
      rows[i].getCell('WAVEFORM').getElement().firstElementChild.style.transform = 'scaleX('+TimelineWidth / (5.0 * TimelineSeconds)+')';
    }
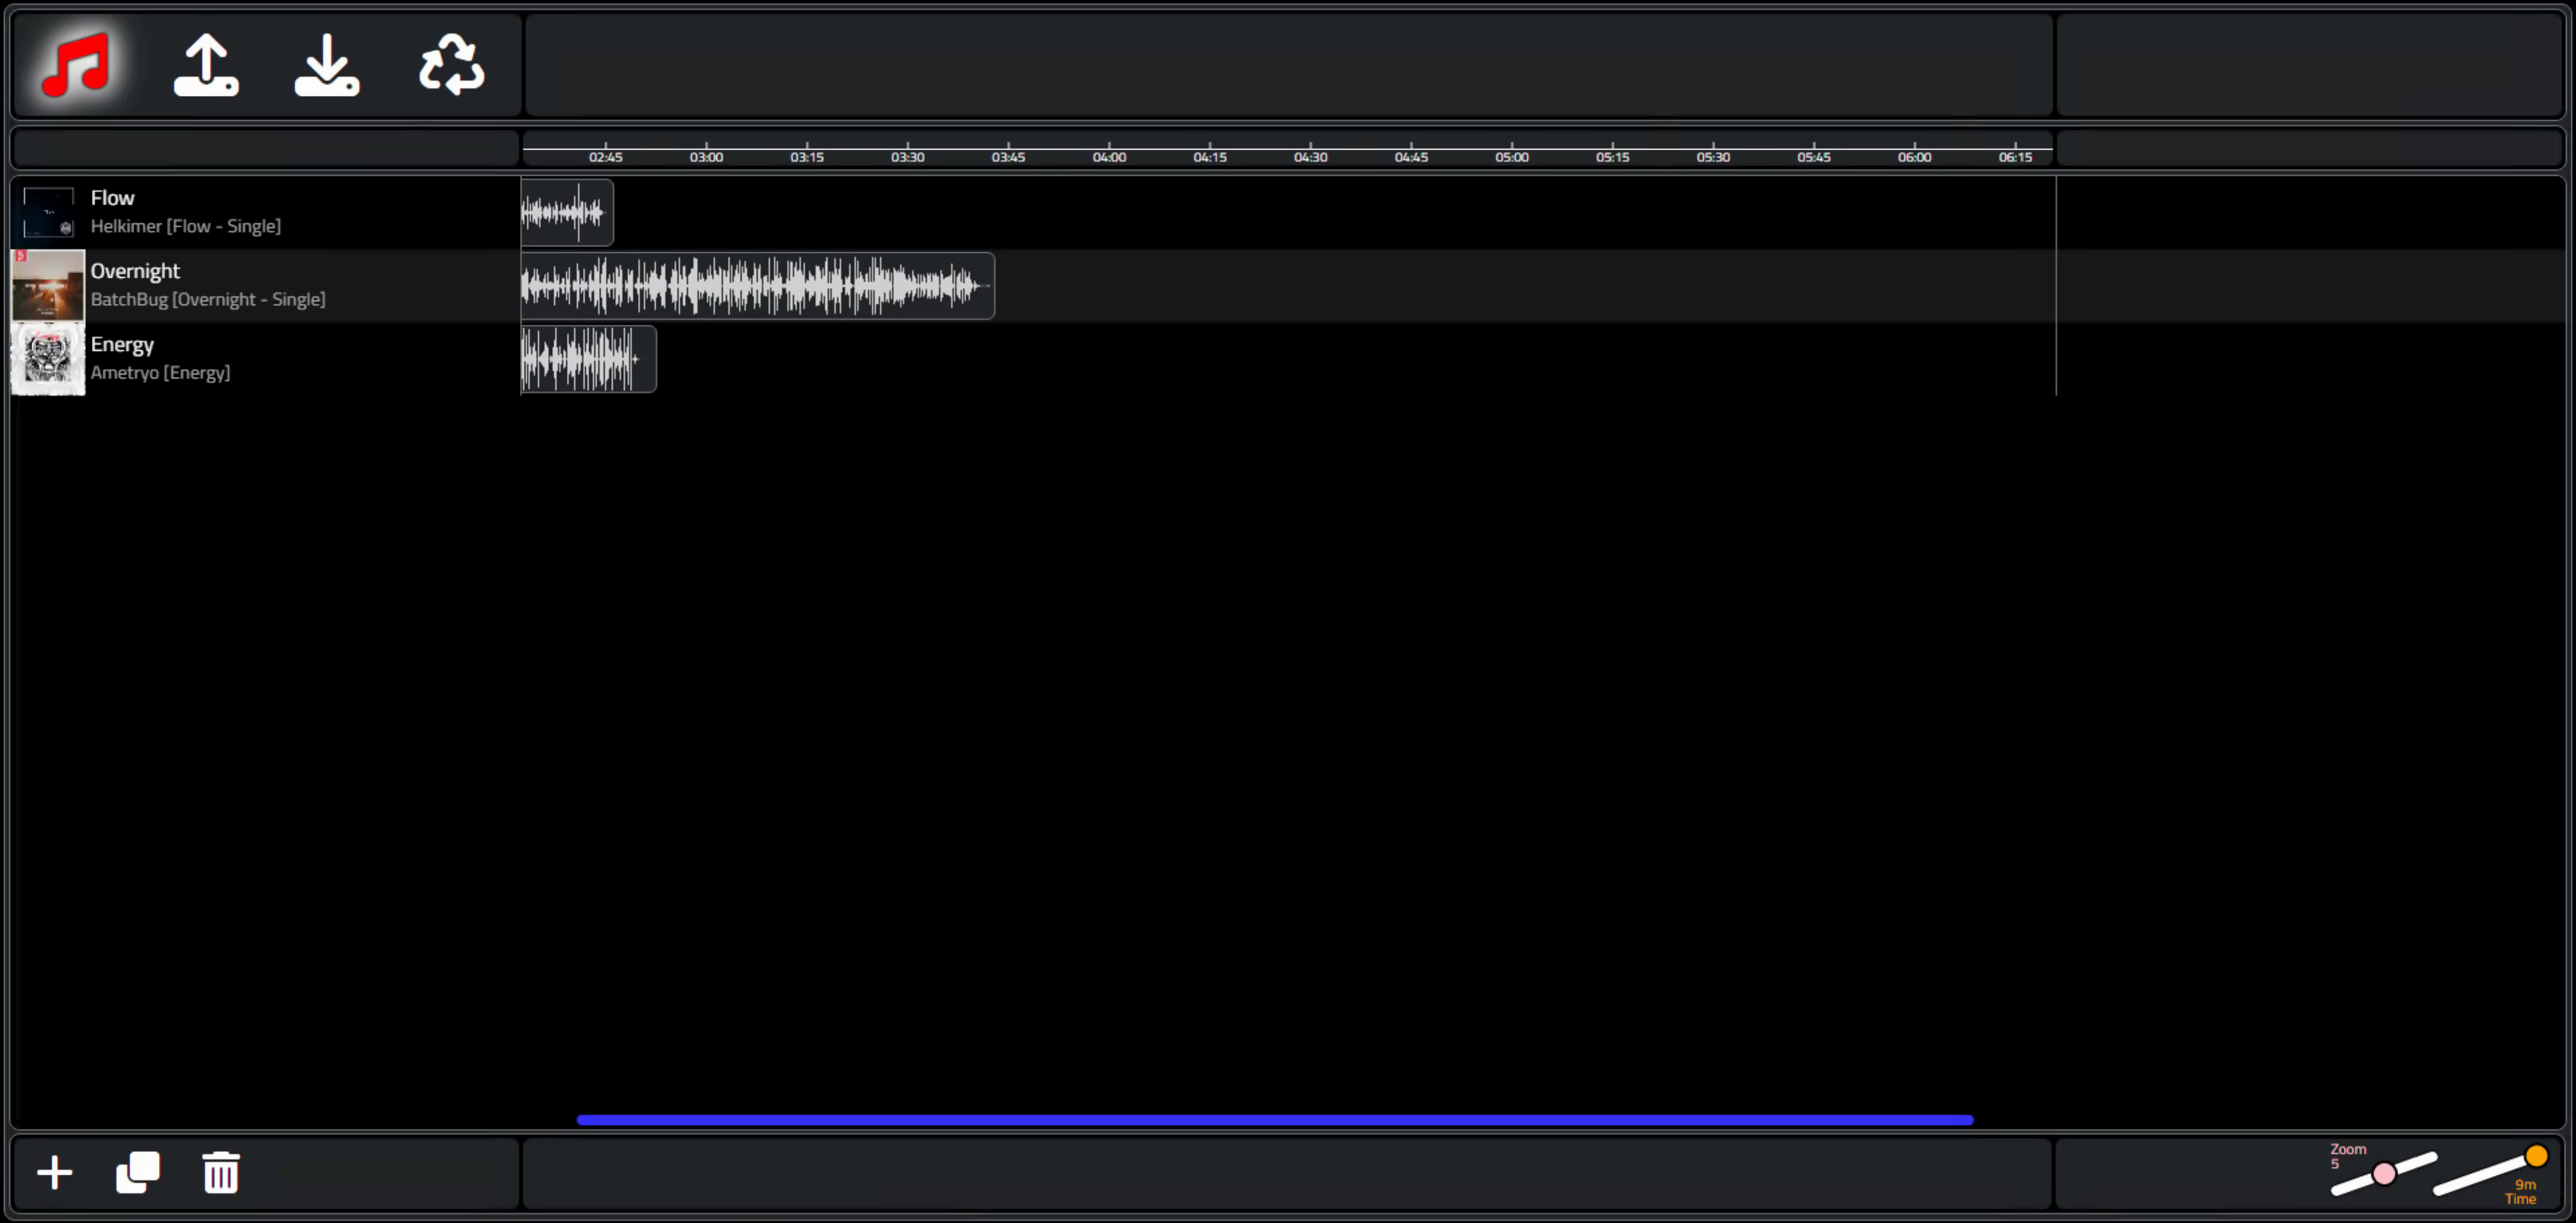
Now, adding in the two range sliders, we've got the following display. Note how the width of the waveforms has been uniformly scaled down because the zoom slider has been used to change the default zoom level. When choosing the level of detail to draw the waveform SVG originally, keep in mind the levels of zoom that are expected, so that the waveform doesn't become too pixelated, or alternatively, that too much data is being generated that is never visible. We're not regenerating the waveform itself here, just applying a scaling factor.
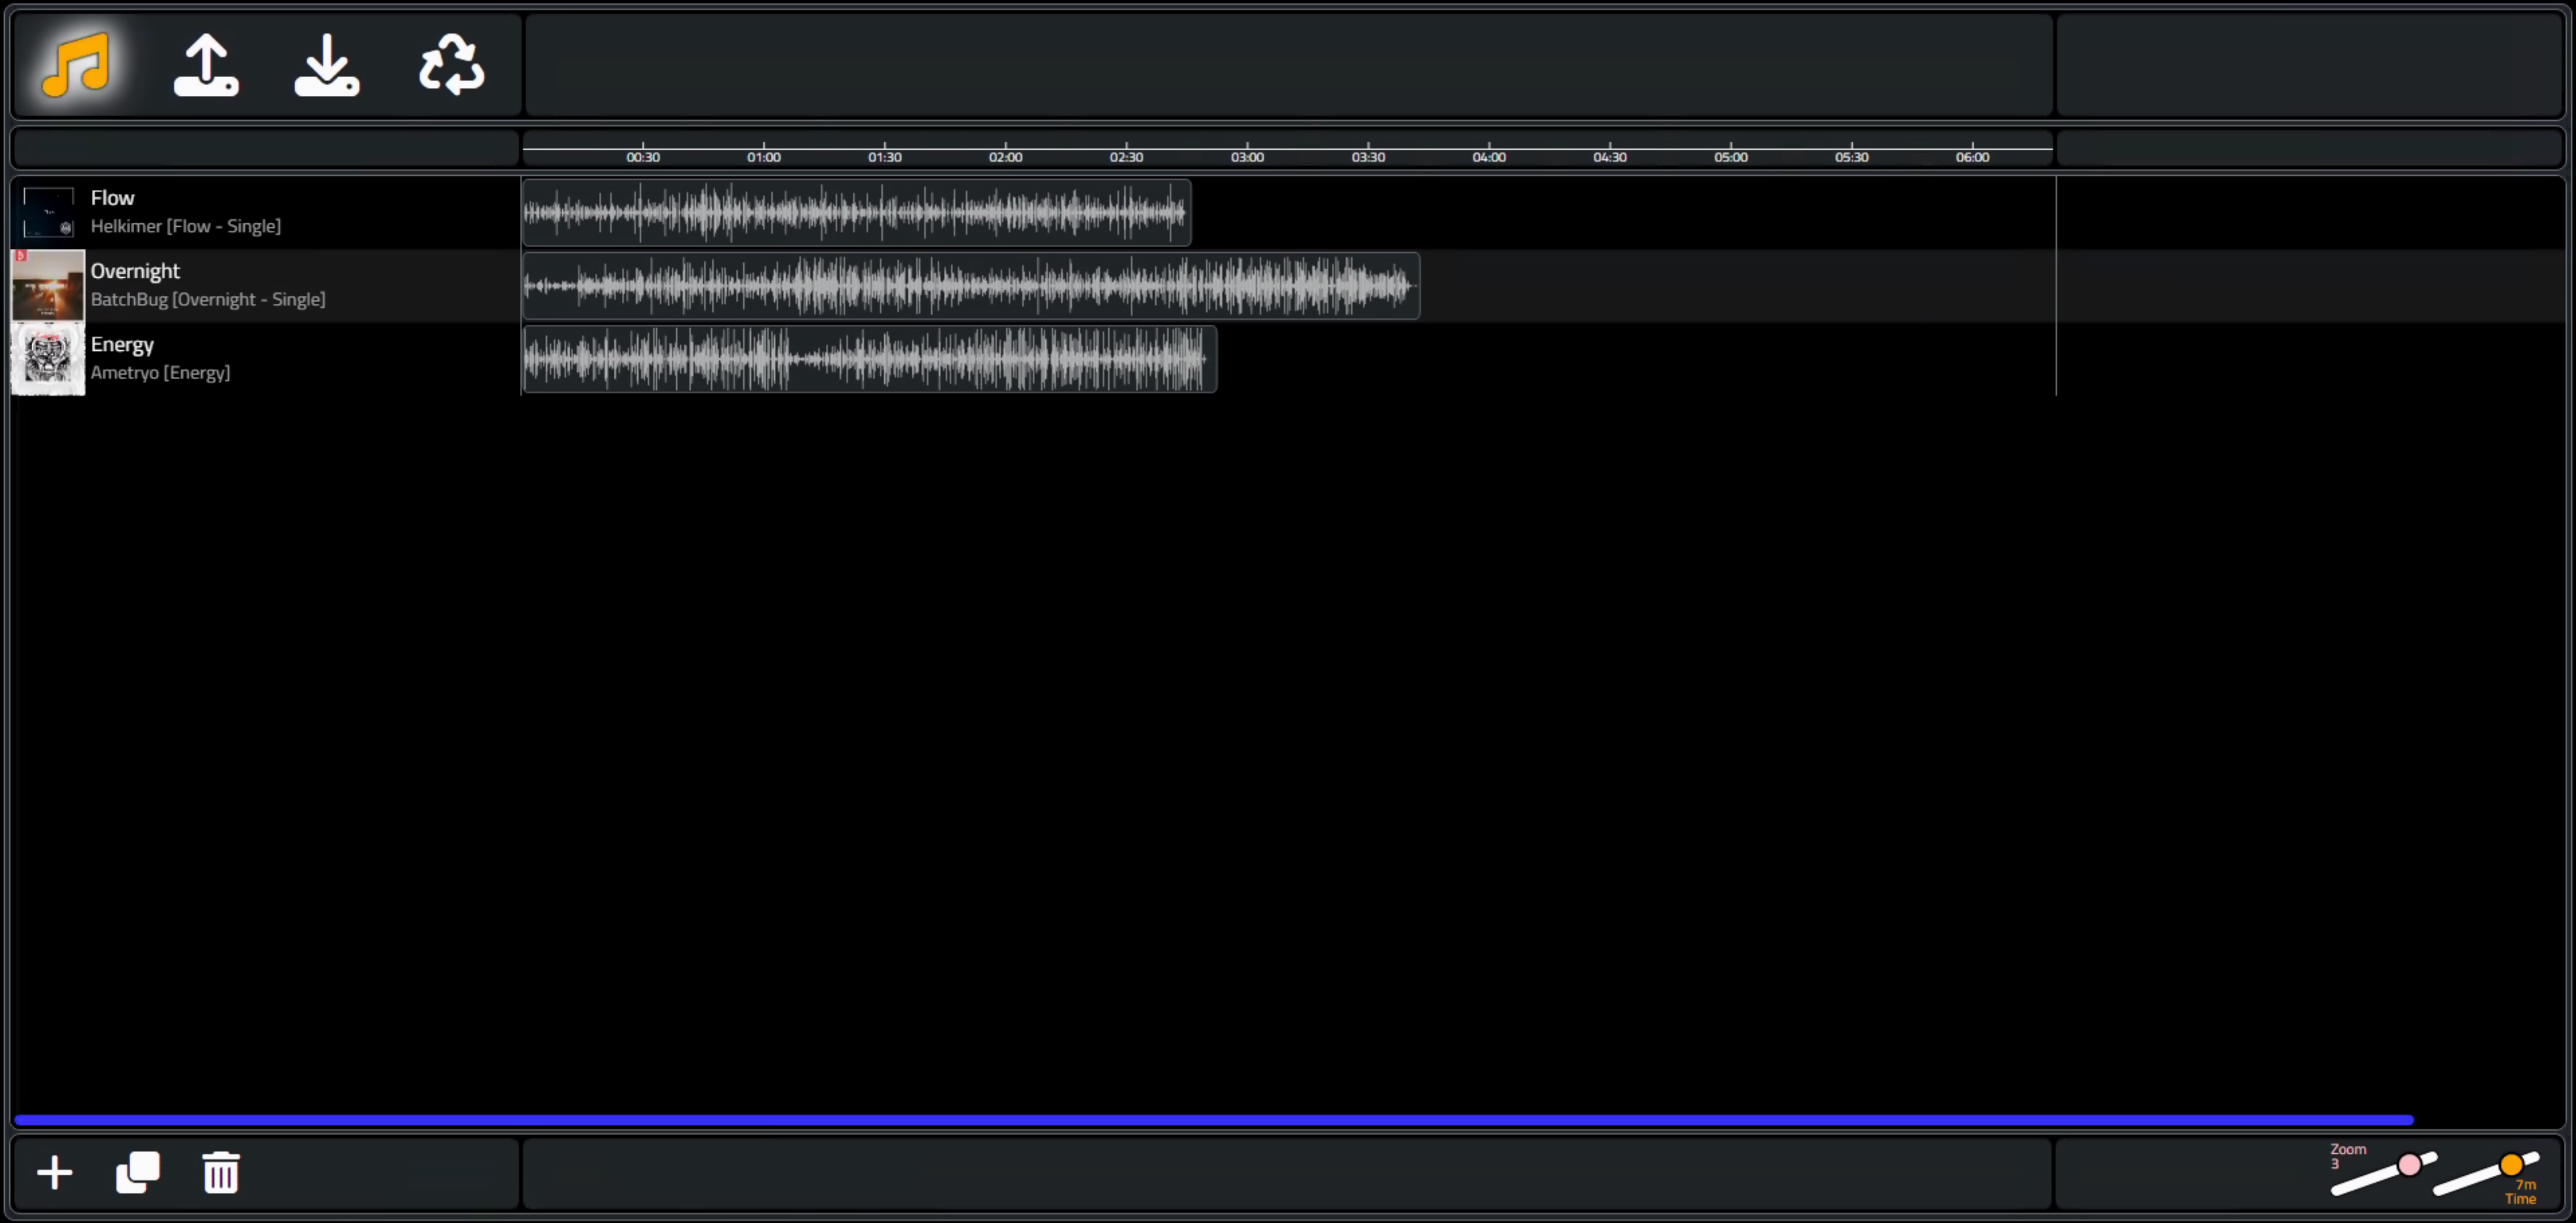
Zoom and Time Functionality.
Alright. Looking good so far. One more item before we continue on. Scrolling time. The table contains a column
that displays the waveform. The other columns in the table are fixed (frozen in Tabulator's parlance) so they
can't be resized, moved, or anything like that. If the sliders at the bottom-right are set in such a way that the
timeline is wider than the horizontal space available in the column (which is the same width as the timeline), then a
scrollbar will appear in the table, and the only thing that it is connected to is the column with the waveform.
Ideally, this scrollbar should also be connected to the timeline. If we shift the column in the table to the right (to see the end of our composition), then the timeline above the table should shift to align with the contents of the column. Put another way, we want the waveform shown linked to the timeline. If the waveform ends at the 3:00 mark, changing the scale or scrolling the waveform horizontally should trigger the timeline to scroll as well so that the 3:00 mark in the timeline remains above the end of the waveform as things are shuffled about.
Tabulator doesn't (currently) expose any events or callbacks related to the scroll position of a given column, but
we can create one of our own using a JavaScript addEventListener method. What we want to do then is move the SVG that is
in the timeline to be offset by the same amount as the scrollbar position. This JavaScript code is added as part
of the code that executes as soon as the Tabulator table has been built. The "scroller"
variable refers to the specific element within our Tabulator table that scrolls. And "timeline" refers to the parent of the SVG that we
want to shift.
      const scroller = document.getElementById("divMiddle").lastElementChild;
      const timeline = document.getElementById("divTimelineChart");
      scroller.addEventListener("scroll",  (e) => {
        timeline.style.transform = 'translateX('+(e.target.scrollLeft * -1)+'px)';
      });
Scrollable Timeline.
That about takes care of this part of the timeline interface. We can completely control what part of the timeline
we're looking at, as well as the parameters that define the timeline itself. And the contents of Tabulator are
automatically scaled to reflect how the timeline is configured.
Track Adjustments.
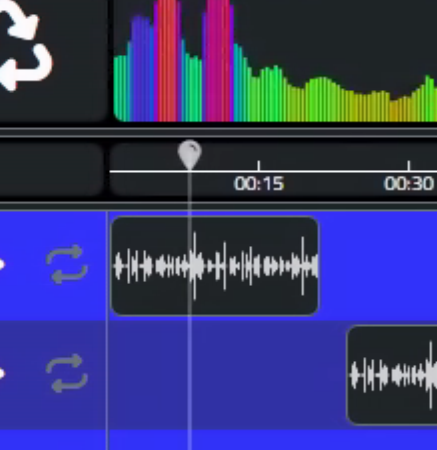
Next up. The real reason we wanted to have the tracks displayed with a waveform wasn't entirely due to cosmetics. We wanted to be able to visualize what was in the tracks themselves, so as to be able to make adjustments. For example, maybe we want to clip the beginning or end of a track that has an excessive amount of silence. Or perhaps we want to overlap one track with another at a particular point that might be readily visible on the waveform. Or any of a number of other adjustments. To start with, we're going to use our InteractJS talents to convert the individual waveforms into elements that can be dragged and resized.
Dragging a track will simply change the start time that the track is played. The only real restriction here is that the track can only be dragged left or right. Other restrictions could be added, such as limiting dragging such that the waveform doesn't extend beyond the beginning or end of the project timeline, but the track can be clipped just as easily without having to do that. Different ways of doing the same thing.
We are going to need two variations for resizing. The first variation will involve simply having the resize-left and resize-right actions clip the start or end of the track. This is a little bit tricky as normally the contents of a <div> start at the left side of the <div>, so by moving the left side of the <div> usually the contents will shift with it. To compensate for that, we'll add another data attribute to InteractJS's code to include this as a negative offset. Resizing from the left will then clip the left side of the track (the start) and resizing from the right will then clip the right side of the track (the end). There are also no restrictions regarding going the other way, so you could extend either end of the track with only silence.
The setup for InteractJS then involves something similar to what we've done for our range sliders.
    function draggableAudioListener (event) {
      var target = event.target
      var x = (parseFloat(target.getAttribute('data-x')) || 0) + event.dx
      target.style.transform = 'translate(' + x + 'px, 0px)'
      target.setAttribute('data-x', x)
    }
    window.draggableAudioListener = draggableAudioListener

    interact('.draggableAudio')
      .resizable({
        edges: { left: true, right: true, bottom: false, top: false},
        listeners: {
          move (event) {
            var target = event.target
            var x = (parseFloat(target.getAttribute('data-x')) || 0)
            target.style.width = event.rect.width + 'px'
            x += event.deltaRect.left
            target.style.transform = 'translate(' + x + 'px, 0px)'
            target.setAttribute('data-x', x)
            if (event.edges.left == true) {
              var t = target.getAttribute('data-t') || 0;
              t -= event.deltaRect.left;
              target.setAttribute('data-t', t);
              target.firstElementChild.style.transform = 'translateX('+t+'px)';
            }
          }
        },
        inertia: true,
        modifiers: [
          interact.modifiers.restrictEdges({
            outer: 'parent'
          }),
          interact.modifiers.restrictSize({
            min: { width: 30 }
      })]})
      .draggable({
        listeners: { move: window.draggableAudioListener },
        inertia: true,
      })
  end;
We can then add "draggableAudio" as a class to the waveforms <div> that are added to the table. This makes it possible to drag them left and right in the timeline, and to adjust their start and end clipping any which way we like. And because we did our homework on how the timeline is connected to the table, everything scrolls and works as you'd expect. Pretty fancy!
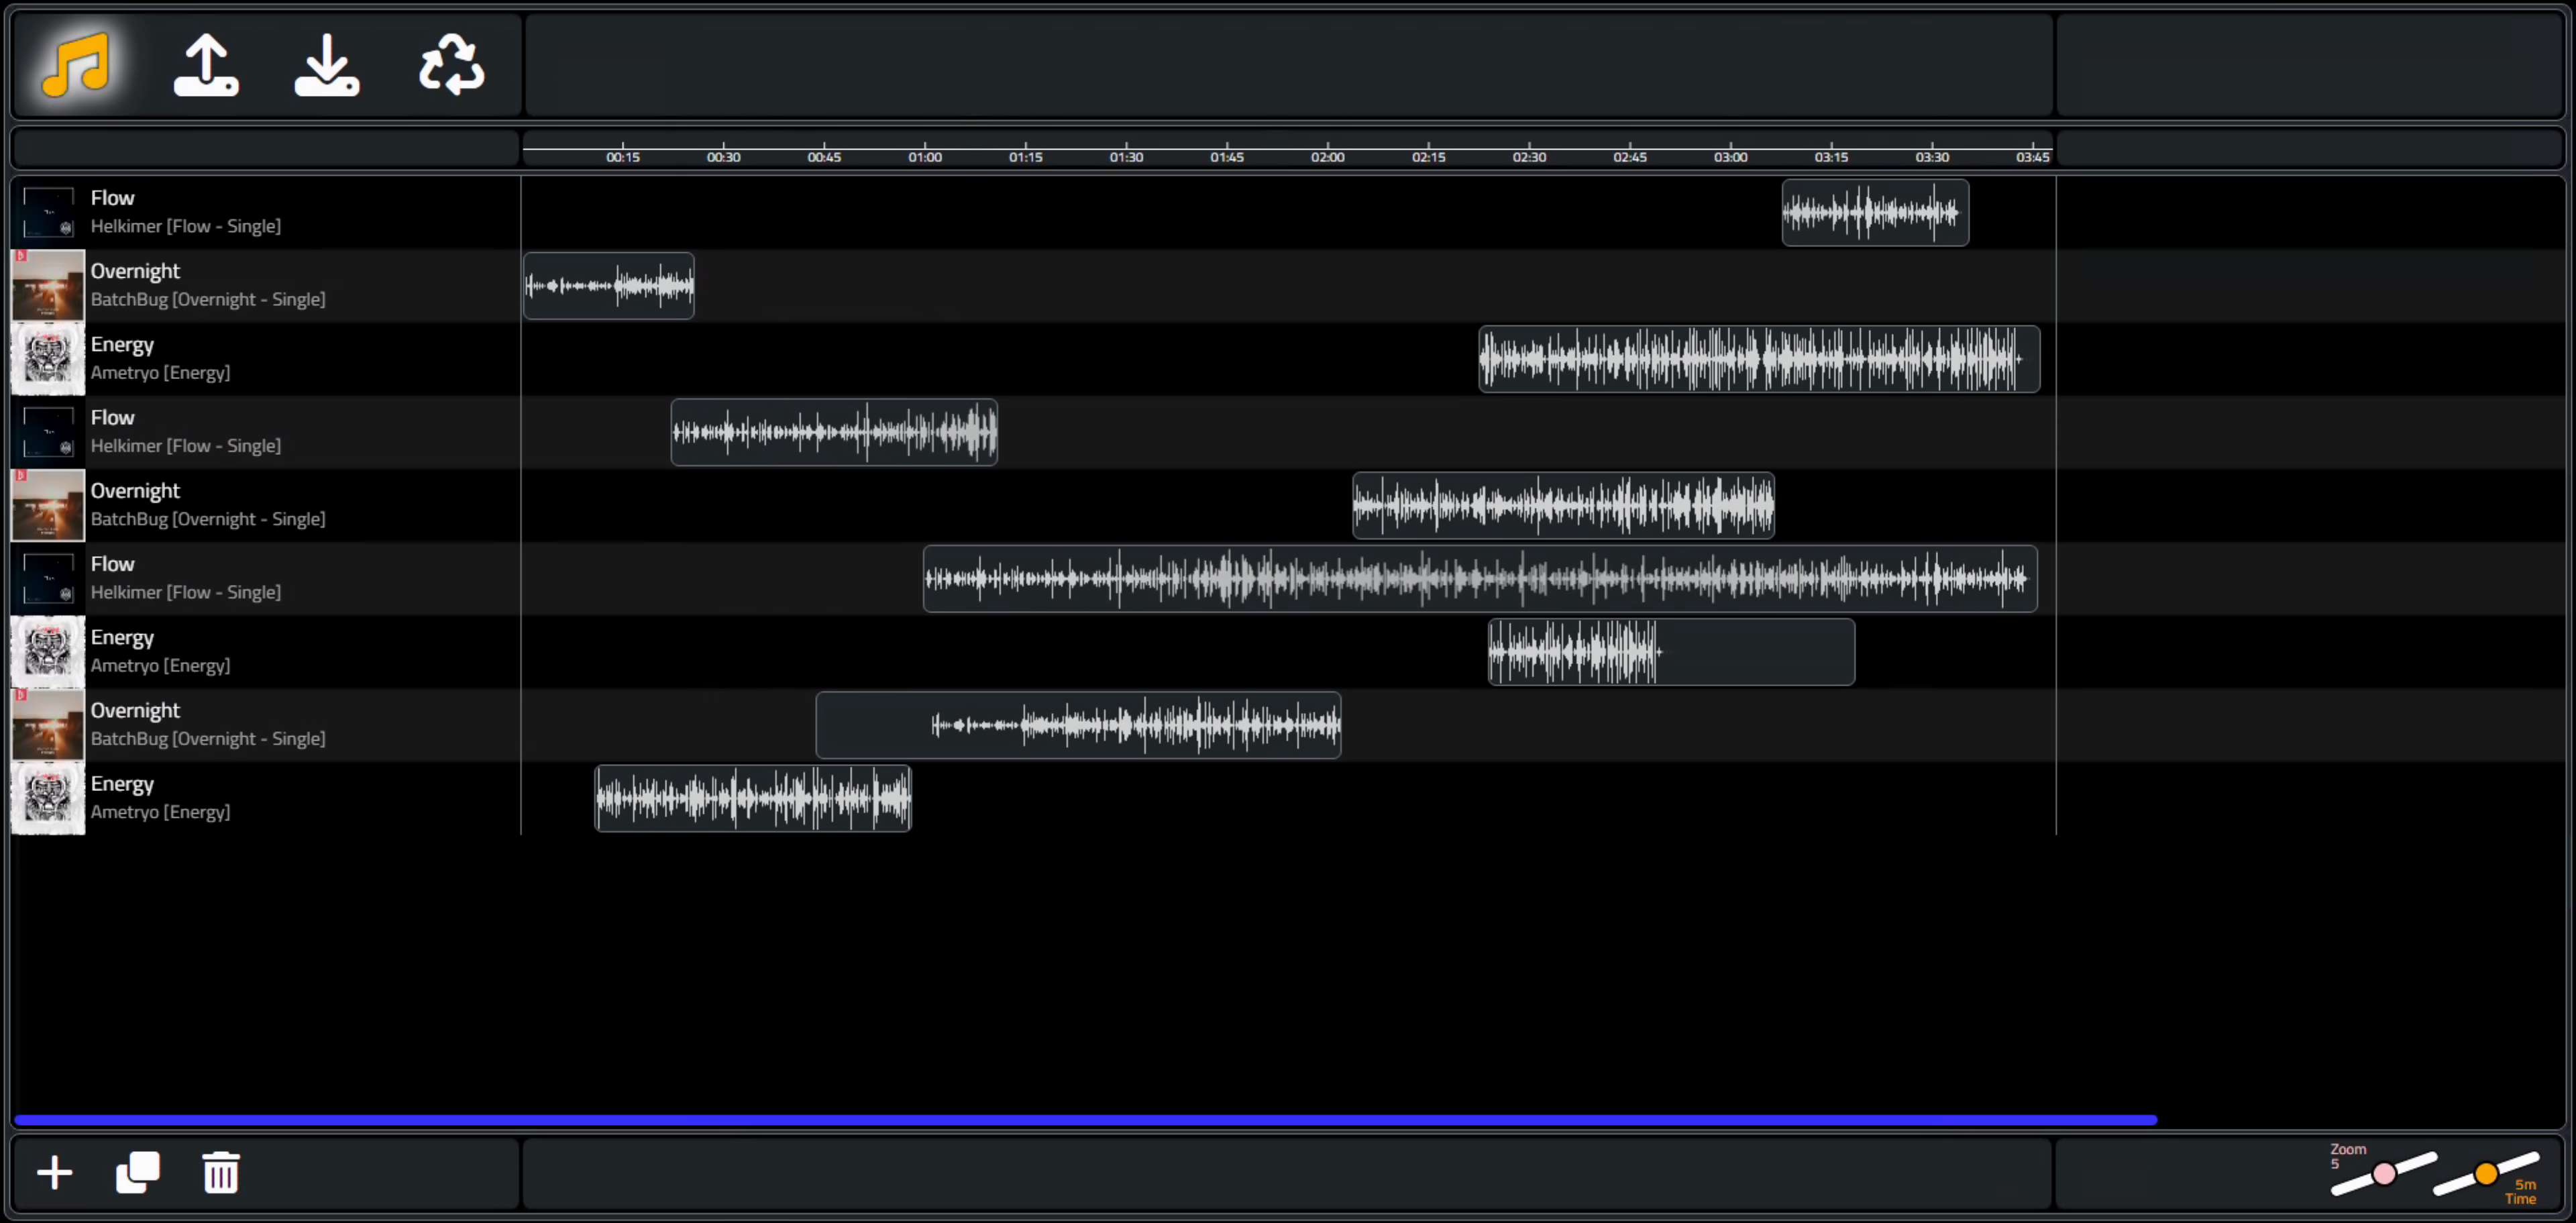
Track Adjustments - Drag and Resize.
There are times though when you're not going to want to resize the track for trimming, but rather to fit the clip into a particular amount of time. Essentially, you're changing the playback rate so that it is faster or slower, thus shrinking or expanding the size of the waveform with respect to the timeline, and having the side-effect of raising or lowering the pitch.
Visually, this means that we're going to want to apply a scale to the waveform to shrink it or expand it to the size set when the sides are resized. To get this to work, we'll need to do two things. First, we'll need a way to distinguish between resizing "modes". And second, we'll need a way to store this scaling data separately from the trimming data, with the ultimate goal of being able to apply both kinds of adjustments to the same track.
For the first part, we'll add a toggle button to the bottom-right corner of the UI. This will indicate which mode we are intending to operate in. If it is switched, then we'll swap the InteractJS class that is applied to the waveforms, which will then change what happens when we resize them. Just for fun, we can also round off the corners of the default TWebToggleButton with a little CSS.
/* add some styling to that switch */
.switch > .slider {
  border-radius: 5px;
  background-color: #000;
}
.switch > .slider::before {
  border-radius: 5px;
}
input:checked + .slider {
  background-color: #33f !important;
}
Toggling it will also call a function that swaps the CSS class from "draggableAudio" to "draggableAudioPitch". In the latter case, we'll use the resized element to determine a scale factor, the inverse of which ends up being the playback rate for that particular track.
This is great in theory but could use a little more finessing on the coding end. Depending on whether you first trim the track and then resize it, things might not work out as expected. Much like applying transforms in CSS happens to be an order-specific kind of thing. Generally, it works, but there should probably be a bit more work put into this. For example, once a track has been scaled down, moving it should probably include the scale factor so that it moves the same way as the unscaled version.
    function draggableAudioPitchListener (event) {
      var target = event.target
      var x = (parseFloat(target.getAttribute('data-x')) || 0) + event.dx
      target.style.transform = 'translate(' + x + 'px, 0px)'
      target.setAttribute('data-x', x)
    }
    window.draggableAudioPitchListener = draggableAudioPitchListener

    interact('.draggableAudioPitch')
      .resizable({
        edges: { left: true, right: true, bottom: false, top: false},
        listeners: {
          move (event) {
            var target = event.target
            var x = (parseFloat(target.getAttribute('data-x')) || 0)
            var tl = (parseFloat(target.getAttribute('data-tl')) || 0)
            var tr = (parseFloat(target.getAttribute('data-tr')) || 0)
            x += event.deltaRect.left
            target.style.transform = 'translate(' + x + 'px, 0px)'

            var svgw = target.firstElementChild.getAttribute('width');
            var scale = (event.rect.width + tl + tr) / svgw;
            target.setAttribute('data-s', scale)

            target.parentElement.style.transformOrigin = x+'px 0px';
            target.parentElement.style.transform = 'scaleX('+scale+')';
          }
        },
        inertia: true,
        modifiers: [
          interact.modifiers.restrictEdges({
            outer: 'parent'
          }),
          interact.modifiers.restrictSize({
            min: { width: 30 }
      })]})
      .draggable({
        listeners: { move: window.draggableAudioPitchListener },
        inertia: true,
      })
This works, most of the time. Applying both kinds of edits to a track can sometimes result in unexpected behavior. So let's mark this scaling feature as "experimental" and move on for now.
Adjusting Tracks - Trimming and Changing Pitch.
More Track Adjustments.
Using the waveform as the UI element for editing things like start time, duration, clipping, changing pitch and so on works pretty well, but there are quite a number of other attributes that could be associated with a track. Fortunately, all the attributes we're going to cover here can be handled with a boolean value or a simple integer value (at the moment) so we can just add simpler elements to the UI to accommodate them.These are more or less easily accessible from the Web Audio API or will be part of the workflow when constructing the AudioGraph that is going to be generated from all these UI elements. One particular curiosity that we'll be exploring shortly is the idea that some Web Audio API elements can be changed while audio is playing. For the moment, we'll just set up the UI for all of them, and then sort out those details later.
- Play / Pause - determines whether the track is started with the rest of the tracks when the project
is played. This might be used when tracks have been added to the project but you don't need to hear them at
the moment. Think of this as the equivalent of the common Delphi "enabled" propertly.
- Loop / NoLoop - determines whether the track will loop when it reaches its end. A further enhancement could involve setting the LoopStart and LoopEnd for a track, something supported in the Web Audio API directly.
- Mute / Unmute - sets the gain for the track to be zero. Useful if you don't initially want to hear the audio for this track, but want to manually enable it sometime during playback.
- Volume - aka gain, a slider that allows you to increase or decrease the gain of this particular
track, 10% for each step.
- Pan - aka balance, a slider that allows you to adjust the Left/Right stereo panning of the track, 25%
for each step.
- Pitch - aka detune, a slider that allows you to increase or decrease the pitch of a track, half an octave (+/- 600 cents) for each step.
- Rate - a slider that allows you to increase or decrease the playback rate of a track, 10% for each
step.
Changing the values of any of these elements will write a new value to the table. At the same time, where
applicable, a change will be made to the AudioGraph in real-time. Did I mention that there would be a lot of range
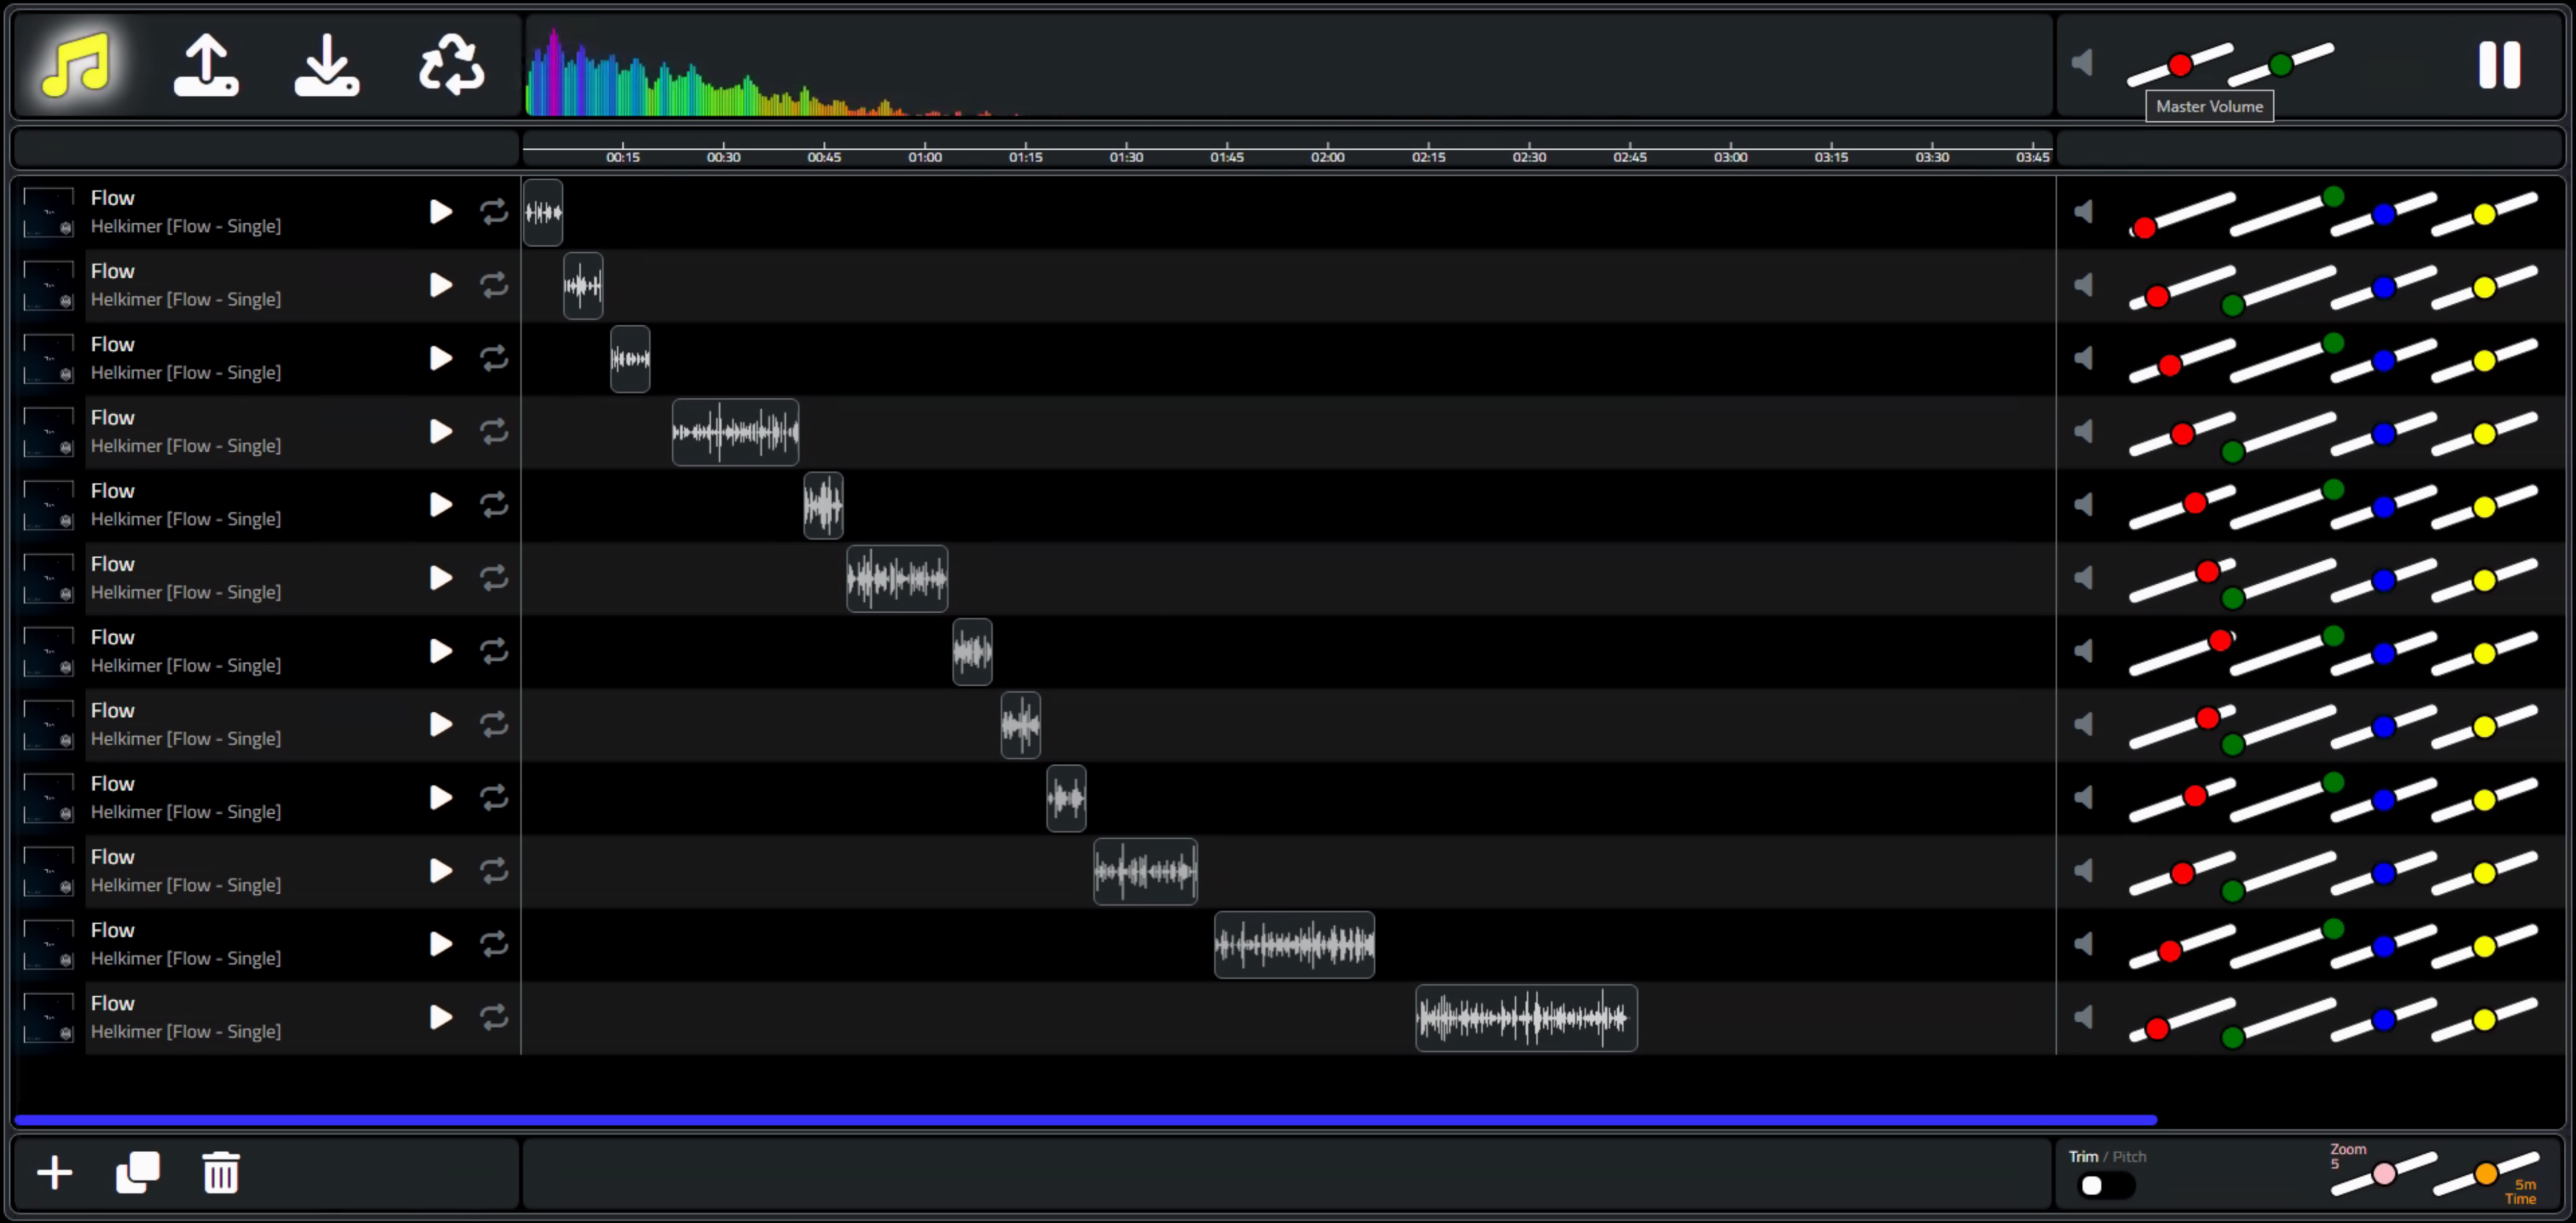
sliders? Pretty sure I did. Here's the resulting interface with the rest of these adjustments added to the UI.
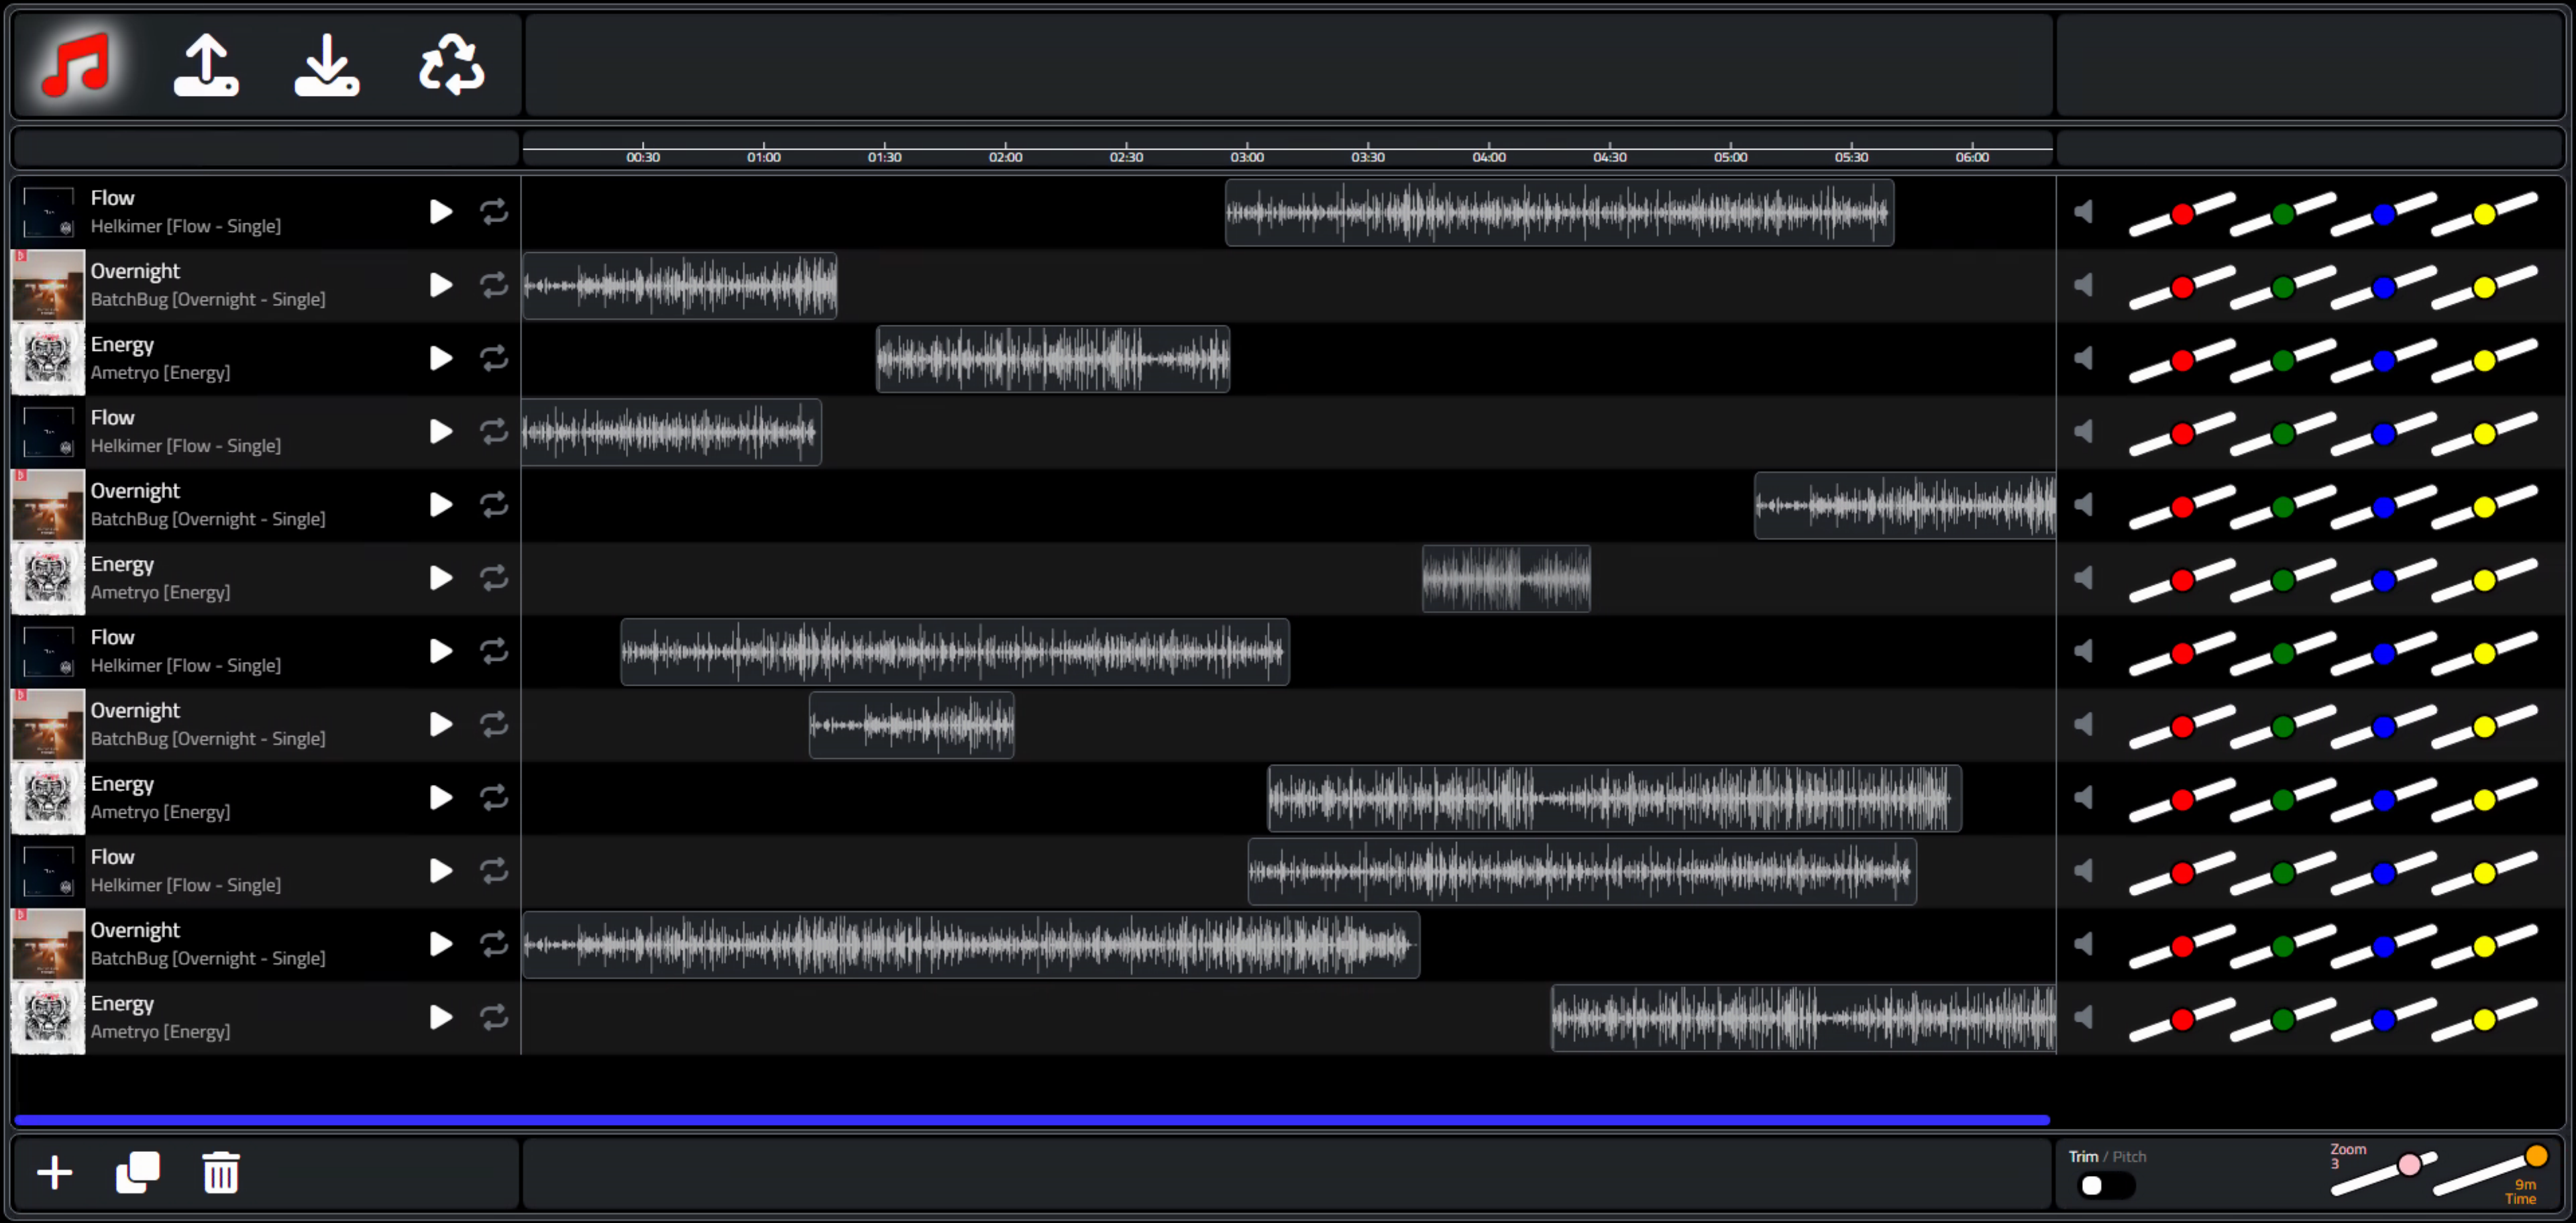
More Tracks, More Editing.
Lots of ways to further refine this UI, and certainly many ways to tailor it to better suit the tastes of any
particular individual, but we've got all the elements in place now to move on to the actual audio-related portion
of this post.
Creating an AudioGraph.
The point of all of this UI work is to provide us with enough information to construct a collection of various AudioNodes in a way that is useful to the user. The idea here is that we'll create an AudioContext, and within that, a series of chains that contain each track and the adjustments we're making to it. These chains will then connect up to a GainNode and an AnalyserNode as we did in the player example, along with a new StereoPannerNode, and then to the destination - speakers for the moment.For each track, we'll have an AudioBufferSourceNode, a
GainNode and a StereoPannerNode, where we can apply the values from the various controls. If we have five tracks
in our project, the structure should look something like this, conceptually.

We can start by just connecting each of the AudioSourceBufferNodes to the GainNode (master volume), StereoPannerNode (master balance), AnalyserNode (visualizer), and destination (speakers) without doing anything else. It will be a bit chaotic if you've got more than one track, but let's just test with one track playing.
We
should also be able to wire up the master volume and master balance at this stage, as well as the logic for the
mute button and the visualizer. This is roughly the same spot we were at with the player example, minus the
positioning controls. To see an example of how we're using the range slider to set specific values, here's what's
hiding behind the master volume slider.
procedure TForm1.trackerVolumeChanged(Value: integer);
begin
  WAAH.VolumeChanged(Value);
  CurrentVolume := Value;
  MuteState := False;
  btnMute.Caption := '<i class="fa-solid fa-volume-off text-secondary fa-xl"></i>';
end;

procedure TWAAH.VolumeChanged(Value: Integer);
begin
  // Value = range 1..9
  asm
    const volarray = [0.00, 0.25, 0.50, 0.75, 1.00, 1.25, 1.50, 1.75, 2.00]
    this.AudioGain.gain.value = volarray[Value-1];
  end;
end;
This is the same approach for the StereoPannerNode, except in that case the range is from -1 to +1 in increments of 0.25, with 0 being the default (non-panned) value. And with that, we have the basics for the master controls in place.
Master Controls and Visualizer Operational.
The setup of the AudioGraph just references the AudioBufferSoundNode without any adjustments so far.
procedure TWAAH.PlayProject;
begin
  asm
    var WAAH = pas.WebAudioAPIHelper.WAAH;
    var rows = WAAH.tabTracklist.getRows();
    for (var i = 0; i < rows.length; i++) {
      var ABSN = new AudioBufferSourceNode(WAAH.AudioCtx);
      ABSN.buffer = rows[i].getCell('TRACKBUF').getValue();
      rows[i].getCell('AUDIOSRC').setValue(ABSN);
      ABSN.connect(WAAH.AudioGain).connect(WAAH.AudioStereoPanner).connect(WAAH.AudioAnalyser).connect(WAAH.AudioCtx.destination);
      ABSN.start();
    }
  end;
end;
The next step then is to do the calculations for the start and end times for the individual tracks. This was why we spent so much time on the UI - now we just need to read the values that we've got there and plug them into the start() function. There are three parameters to the start() function: start, offset, and duration.
- start refers to the time, relative to the current time of the AudioContext, that playback should
start. If we've moved the track to the right, then the amount that it was moved should correspond to this
start time. If the track has been clipped at the start, then the start time should still point to the
beginning of the unclipped track.
- offset refers to what point within the track the playback should start. If the track was moved to the left of the main display, then the offset should correspond to the first visible part of the track. If the track has been clipped, then the offset will correspond to where the beginning of the clip is.
duration refers to how much of the clip is to be played back. If the track has been clipped at the end, then the duration will be less than the length of the track.
At the same time, we can plug in whatever values we've got available from the other UI elements.
- If the play button is highlighted, then playback will be enabled. Otherwise, the track will be added but not played.
- The loop value is a property of AudioBufferSourceNode, so it can just be set.
- The track volume (or mute value) as well as the balance can be assigned to a GainNode and a StereoPanner node that are created specifically for this track.
- The Pitch (detune) and Speed (playbackrate) values are also properties of AudioSourceBufferNode.
The ugly bits from the InteractJS code to handle all the range sliders look something like the following - these all update in real-time!
      // Is this one of the trackbars from the table?
      if (target.id.indexOf('track-') >= 0 ) {
        var rowid = target.id.substr(10,5);
        var typ = target.id.substr(6,3);
        var table = pas.WebAudioAPIHelper.WAAH.tabTracklist;
        var row = table.getRow(rowid);
        table.selectRow(rowid);

        if (typ == 'Vol') {
          row.getCell('TRACKGAIN').setValue(1 + parseInt(newx / 10));
          if (row.getCell('AUDIOGAIN').getValue() !== null) {
            const volarray = [0.00, 0.25, 0.50, 0.75, 1.00, 1.25, 1.50, 1.75, 2.00]
            row.getCell('AUDIOGAIN').getValue().gain.value = volarray[parseInt(newx /10)]
          }
        }
        else if (typ == 'Pan') {
          row.getCell('TRACKPAN').setValue(1 + parseInt(newx / 10));
          if (row.getCell('AUDIOPAN').getValue() !== null) {
            const panarray = [-1.00, -0.75, -0.50, -0.25, 0.00, 0.25, 0.50, 0.75, 1.00]
            row.getCell('AUDIOPAN').getValue().pan.value = panarray[parseInt(newx /10)]
          }
        }
        else if (typ == 'Dtn') {
          row.getCell('TRACKPITCH').setValue(1 + parseInt(newx / 10));
          if (row.getCell('AUDIOSRC').getValue() !== null) {
            const detunearray = [-2400, -1800, -1200, -600, 0, 600, 1200, 1800, 2400]
            row.getCell('AUDIOSRC').getValue().detune.value = detunearray[parseInt(newx /10)]
          }
        }
        else if (typ == 'Spd') {
          row.getCell('TRACKSPEED').setValue(1 + parseInt(newx / 10));
          if (row.getCell('AUDIOSRC').getValue() !== null) {
            const ratearray = [0.2, 0.4, 0.6, 0.8, 1.0, 1.2, 1.4, 1.6, 1.8]
            row.getCell('AUDIOSRC').getValue().playbackRate.value = ratearray[parseInt(newx /10)]
          }
        }
      }
Note that the third and fourth sliders kind of do the same thing... Changing the pitch is analogous to changing the speed. There might be other parameters that we can add here, but for now, this is what is offered up by the Web Audio API, so we'll go with what we've got. Still quite fun to play with.
The PlayProject code now looks like this.
procedure TWAAH.PlayProject;
begin
  asm
    var WAAH = pas.WebAudioAPIHelper.WAAH;
    var rows = WAAH.tabTracklist.getRows();
    for (var i = 0; i < rows.length; i++) {
      var ABSN = new AudioBufferSourceNode(WAAH.AudioCtx);
      var GAIN = new GainNode(WAAH.AudioCtx);
      var PAN = new StereoPannerNode(WAAH.AudioCtx);

      ABSN.buffer = rows[i].getCell('TRACKBUF').getValue();

      rows[i].getCell('AUDIOSRC').setValue(ABSN);
      rows[i].getCell('AUDIOGAIN').setValue(GAIN);
      rows[i].getCell('AUDIOPAN').setValue(PAN);

      if (rows[i].getCell('LOOP').getValue() == true) {
        ABSN.loop = true;
      }

      const volarray = [0.00, 0.25, 0.50, 0.75, 1.00, 1.25, 1.50, 1.75, 2.00];
      GAIN.gain.value = volarray[rows[i].getCell('TRACKGAIN').getValue() -1];

      const panarray = [-1.00, -0.75, -0.50, -0.25, 0.00, 0.25, 0.50, 0.75, 1.00];
      PAN.pan.value = panarray[rows[i].getCell('TRACKPAN').getValue() -1];

      const detunearray = [-2400, -1800, -1200, -600, 0, 600, 1200, 1800, 2400];
      ABSN.detune.value = detunearray[rows[i].getCell('TRACKPITCH').getValue() -1]

      const ratearray = [0.20, 0.40, 0.60, 0.80, 1.00, 1.20, 1.40, 1.6, 1.80];
      ABSN.playbackRate.value = ratearray[rows[i].getCell('TRACKSPEED').getValue() -1];

      if (rows[i].getCell('MUTE').getValue() == true) {
        GAIN.gain.value = 0;
      }

      ABSN.connect(GAIN)
          .connect(PAN)
          .connect(WAAH.AudioGain)
          .connect(WAAH.AudioStereoPanner)
          .connect(WAAH.AudioAnalyser)
          .connect(WAAH.AudioCtx.destination);

      var playstart = 0;
      var playoffset = 0;
      var playduration = ABSN.buffer.duration;

      var tracklength = parseFloat(rows[i].getCell('WAVEFORM').getElement().firstElementChild.firstElementChild.firstElementChild.getAttribute('width'));
      var trackstart = parseFloat(rows[i].getCell('WAVEFORM').getElement().firstElementChild.firstElementChild.getAttribute('data-x') || 0);
      var tracktl = parseFloat(rows[i].getCell('WAVEFORM').getElement().firstElementChild.firstElementChild.getAttribute('data-tl') || 0);
      var tracktr = parseFloat(rows[i].getCell('WAVEFORM').getElement().firstElementChild.firstElementChild.getAttribute('data-tr') || 0);

      playstart = WAAH.AudioCtx.currentTime + ((trackstart / tracklength) * playduration);
      playoffset = ((tracktl * -1) / tracklength) * playduration;
      playduration = ((tracklength + tracktl - tracktr) / tracklength) * playduration;

      if (rows[i].getCell('PLAY').getValue() == true) {
        ABSN.start(playstart, playoffset, playduration);
      }
    }
  end;
end;
Obviously, there are opportunities to remove code duplication here, and likely many other refinements, but the basics
are in place and it works as designed. By taking a track and cloning it a bunch of times, we can set up a bit of
an audio test by trimming consecutive sections and adjusting the track parameters on the right to alternate
left/right or alter the volume (for example) just to ensure that everything is wired up correctly.
As a section is playing, the range sliders can be adjusted for immediate effect. Works pretty well, at least for tracks that are trimmed. Dealing with tracks that are scaled is perhaps a project for another day.
Testing TrackEditor.
A Sign of Progress.
Almost there. It would be helpful to have some kind of indication of where we're at during playback. Typically this is indicated by having a vertical line that shows the current position. So let's do that. We'll prepare for having this as a control that can be moved, but for the time being, we'll start with just the display aspects. We can get the cursor position by using the timeline math and the time since play started. Kind of a headache to sort out, but this includes the math for different timeline scales, offsets, and so on.
function TWAAH.GetCursorPosition: Integer;
begin
  asm
    var WAAH = pas.WebAudioAPIHelper.WAAH;
    var startpos = 384;
    var playtime = WAAH.AudioCtx.currentTime - WAAH.AudioStart; // seconds
    Result = Math.max(startpos, startpos + ((playtime / WAAH.TimelineTime) * WAAH.TimelineLength) - WAAH.TimelineOffset);
  end;
end;
The cursor itself is just an upside-down droplet (angling for a guitar pick look) and a vertical line that stretches across all the tracks. Or maybe think of it as a balloon with a really long string.
TrackEditor Cursor.
The cursor has been set up with another InteractJS configuration, but the logic to implement a movable play head
remains on the to-do list. So does scrolling the tracklist to the right once the cursor hits the right edge. Lots
of little touches have been implemented already, but many more keep cropping up as things unfold.
One More Thing.
One more thing before we wrap this up. Everything is working well in terms of UI, loading multiple tracks, and so on. But at the end of the day, the point of the exercise is likely to produce a new audio file that can be used elsewhere. So how do we save whatever audio we've created?
By default, the destination is set to output to speakers. Getting around that can be a bit tricky. The built-in methods for doing this are not particularly enticing as they don't output any formats that anyone has heard of. And the recommended third-party library is also not particularly capable nor actively supported. Not a lot of great options here.
However, there is a workable solution. For our project, I've set it up to export .WAV files, but the same library can also export MP3 and OGG files as well. This uses a third-party library called WebAudioRecorder.js which is also quite old and not actively supported. So old in fact that there is no usable CDN option. Boo! Here is a post that describes in some detail how it works. It gets connected to an AudioNode (I've used the last node in the chain - the AnalyserNode) and records the data passing through it. Once the playback stops, it then converts the data into a blob which can be downloaded.
Here's what has been added to the beginning of the PlayProject code.
procedure TWAAH.PlayProject;
begin
  asm
    var WAAH = pas.WebAudioAPIHelper.WAAH;
    var rows = WAAH.tabTracklist.getRows();
    WAAH.AudioStart = WAAH.AudioCtx.currentTime;

    WAAH.AudioRecorder = new WebAudioRecorder(WAAH.AudioAnalyser, {
      workerDir: "js/"
    });

    WAAH.AudioRecorder.setOptions({
      timeLimit: 300,
      encodeAfterRecord: true,
      ogg: {
        quality: 0.5
      },
      mp3: {
        bitRate: 160
      }
    });

    WAAH.AudioRecorder.onComplete = function(recorder, blob) {
      console.log("Encoding complete");
      document.getElementById('btnExport').innerHTML = '<i class="fa-solid fa-bullseye text-success fa-3x"></i>';
      WAAH.AudioBlob = blob;
    }

    WAAH.AudioRecorder.startRecording();
    document.getElementById('btnExport').innerHTML = '<i class="fa-solid fa-bullseye text-danger fa-beat-fade fa-3x"></i>';
Once the recording is complete, we now have a blob to download, just as we do when loading and saving projects. This is hidden behind the button at the top, so it doesn't pop up each time like the example does. The file is created each time in case you want to download it, but you need to click the button for the download to occur.
procedure TWAAH.ExportProject;
begin
  asm
    var WAAH = pas.WebAudioAPIHelper.WAAH;
    var streamSaver = window.streamSaver;
    const fileStream = streamSaver.createWriteStream('New Audio.wav', {
      size: WAAH.AudioBlob.size // Makes the procentage visiable in the download
    })
    const readableStream = WAAH.AudioBlob.stream()
    window.writer = fileStream.getWriter()
    const reader = readableStream.getReader()
    const pump = () => reader.read()
      .then(res => res.done
          ? writer.close()
          : writer.write(res.value).then(pump))
    pump()
  end;
end;
There's nothing special in terms of a UI for managing the files - just a "New Audio.wav" file is created and downloaded (and likely renamed to New Audio(x).wav each time). Another area for improvement. But in any event, it should be possible to create all kinds of interesting things, as these files can of course be loaded back up into the TrackEditor and used again. To test, for example, you can load up a pair of audio files and then set the stereo panning for each in opposing directions. After playing this combo, you can then save a new .wav file that will have the two audio files combined - one playing on the left speaker and one on the right, just as it was played in the TrackEditor.
Sound Off.
Alright. That about covers it for today. There is still a ton of material within the Web Audio API we've not touched yet, but at this point, it should not be too challenging to see where the parts fit and what kinds of things you can do with them. There are a number of AudioNodes, for example, that can be used to create sounds from scratch, or to modify sounds and do all kinds of things. I'm not an audio expert by any means, so this has been an adventure already. But if anyone would be interested in seeing a Part 3, by all means, please sound off in the comments about what you'd like to see (or hear!).
As usual, the complete TMS WEB Core project file is included. The most current version of the code for this project can also be accessed via its GitHub repository. And finally, a live demo link has been set up so you can try out the TrackEditor right now.
Live
Demo
GitHub Repository
Download Example Project
Follow Andrew on 𝕏 at @WebCoreAndMore or join our 𝕏 Web Core and More Community.
Andrew Simard
Bookmarks:

This blog post has received 2 comments.
 2. Saturday, October 8, 2022 at 8:04:27 AM
Thanks for the kind words! There are certainly many enormous benefits to be found using TMS WEB Core, not the least of which are development speed (this is RAD after all!) and platform reach, particularly when compared to VCL projects.
2. Saturday, October 8, 2022 at 8:04:27 AM
Thanks for the kind words! There are certainly many enormous benefits to be found using TMS WEB Core, not the least of which are development speed (this is RAD after all!) and platform reach, particularly when compared to VCL projects.
Andrew Simard
All Blog Posts | Next Post | Previous Post
Anybody looking for a simple cross-platform solution that only requires knowlege of Delphi/Pascal, HTML, CSS, and javascript needs to look at TMS WebCore. You don''t need to get your app approved by any app store, you can build-in your own mechanisms to accept payments, you don''t need to pay anybody a percentage of your earnings, and it''s probably easier to find people to support the code than every possible device''s native programming environment.
If these two posts don''t give a clear and compelling reason to seriously check out what WebCore can do for you, I don''t know what would.
Schwartz David