Blog
All Blog Posts | Next Post | Previous Post

 TMS WEB Core beta v2.3 brings debugging web apps from the Delphi IDE
Bookmarks:
Tuesday, September 12, 2023
 Breakthrough!
After months and months of research & development, we're eager to share with you the first beta of TMS WEB Core v2.3 that features debugging web apps from the Delphi IDE.
Since its inception, TMS WEB Core offered a debugging experience via the browser console. Thanks to a generated source map file, it is fortunately already possible to step through Object Pascal code and inspect Object Pascal variables from the browser, it is still a two step process to develop from the Delphi IDE and debug from the browser console.
Technical background
Even though technically extremely challenging, our team of experts José Leon Serna & Roman Kassebaum set their goal on offering a debugging experience for TMS WEB Core web apps directly out of the Delphi IDE. Fortunately, the Chrome browser engine features the DevTools Protocol with which it is possible to take over debugging from an external application, in this case the Delphi IDE. Technically this works via a WebSocket server with which the browser communicates in this case to the TMS WEB Core Delphi IDE plugin. Keeping the "eat your own dogfood" mantra in mind, this WebSocket server was implemented using TMS FNC WebSocket. On the other side, we could fortunately also find sufficient IDE extension APIs as well as a few places where we needed to hook code, to add this custom debugging interface to the Delphi IDE.
Browsers
At this moment, the DevTools Protocol is available with Google Chrome browser and Microsoft Edge Chromium browser. So only if you instruct TMS WEB Core to run the app in either Google Chrome or Microsoft Edge Chromium, the debugging from the Delphi IDE will be working. The FireFox browser does noy fully implement the DevTools Protocol, so it remains under research if we will technically also be able to bring this debugging experience for FireFox. Of course, it still remains possible to debug using Object Pascal code from the browser console in all browsers TMS WEB Core can target.
Configuration and limitations
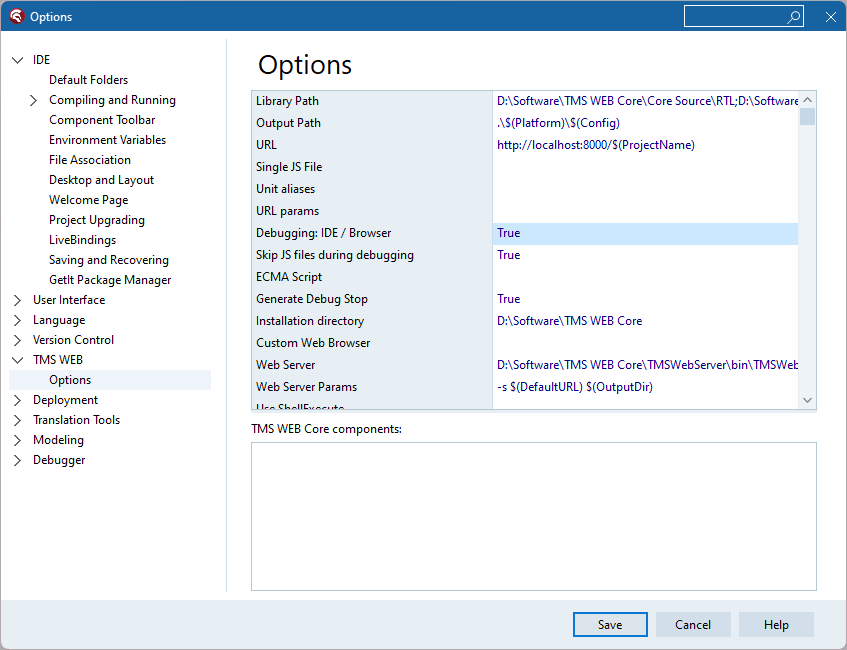
From the Delphi IDE, you can globally define whether you want debugging from the Delphi IDE or debugging from the browser console. This setting is under Tools, Options, TMS WEB, "Debugging IDE / Browser". But you can also define this at project level under Project Options, TMS WEB, "Debugging IDE / Browser".
When debugging from the Delphi IDE is enabled, set your breakpoints in the Delphi code editor and the IDE will automatically stop the app at the breakpoint and you can use the shortcuts F7,F8,F4 to step in, step over, step to lines of code. When you hover over variables, the IDE will show the variable value in a hint and you can also inspect values via Debug, Evaluate/Modify. With this is a limitation though if you want to inspect objects, object properties, etc.. that the expression you specify is expected to be a JavaScript expression. Behind the scenes, this expression is sent to the browser over websocket communication and the browser only understands JavaScript. The only way we could technically overcome this is by transpiling on the fly such Object Pascal expression to JavaScript, but this is far from trivial and as such currently not yet possible. Fortunately, the JavaScript expression for variables matches with Object Pascal expressions and with some getting used to, you'll be able to inspect most of what you need this way.
Another subtle difference when you debug from the Delphi IDE is that the Delphi IDE starts a new browser instance for every session and also, when you terminate the debugging session from the IDE, the IDE will close this browser instance. This is because there is a unique websocket communication channel between the IDE and the browser instance used for debugging. Nothing prevents you to still open the browser console for the browser where the debugging session is running and inspect the DOM, code, networking tab etc...
See it for yourself
Check our first video showing how you can debug a TMS WEB Core web app running in the browser from the Delphi IDE:
Get started with the beta
We have made the v2.3 beta available now for all active TMS ALL-ACCESS users. Login on our website under Account / My Products and download and install this beta. Our team is very interested to hear about your experiences and closely work together in case some glitches might be found in this beta or to listen for your further ideas to improve the experience with TMS WEB Core. As always, you can follow-up in the Support Center or via direct email.
Bruno Fierens
Bookmarks:

This blog post has received 11 comments.
2. Wednesday, September 13, 2023 at 2:23:25 AM
This is great work Bruno!
Ian Barker
3. Wednesday, September 13, 2023 at 11:09:04 PM
Outstanding!
Peterson Terry
4. Thursday, September 14, 2023 at 12:30:54 PM
Awesome! Thanks a lot.
Kossow Roland
5. Thursday, September 14, 2023 at 5:09:37 PM
This is an exciting enhancement!
Martin Jeffrey
6. Thursday, September 14, 2023 at 6:18:50 PM
Excellent! Can''t wait to test it!
Weyers Walter
7. Thursday, September 14, 2023 at 6:54:31 PM
After install (Version Webcore is shown as 2.3.0.0 in same window) I can''t see the point "Debug IDE" and "Skip JS".I''m using a german IDE.
Mueller Mario
8. Thursday, September 14, 2023 at 7:03:03 PM
Switching to ''english'' doesn''t help
Mueller Mario
 9. Friday, September 15, 2023 at 8:04:23 AM
Do you see it is version v2.3.0.0 from the IDE Menu : Help, About TMS WEB Core?
9. Friday, September 15, 2023 at 8:04:23 AM
Do you see it is version v2.3.0.0 from the IDE Menu : Help, About TMS WEB Core?If not, close IDE, force uninstall via Windows Control Panel and then reinstall on a clean IDE.
Bruno Fierens
10. Friday, September 15, 2023 at 8:59:54 AM
Thanks Bruno, works now
Mueller Mario
11. Thursday, September 21, 2023 at 1:47:11 PM
That''s exciting news! Thank you for continuous work on this great product.
Stoll Meik
All Blog Posts | Next Post | Previous Post
Monterisi Stefano