Blog
All Blog Posts | Next Post | Previous Post

 Visualize your own data structure in Delphi
Bookmarks:
Wednesday, April 27, 2022
In April, we did a blog on how to retrieve Google Analytics results, and display them in a TMS FNC Chart instance. The data, coming from the request, was displayed in a points collection. Did you know that you can also map your own data structure? TMS FNC Chart is designed to easily integrate your own data with a couple of lines of code. This blog will cover this, but first, let's take a look at a general introduction video on what TMS FNC Chart has to offer.
Introduction
Data mapping
For the purpose of this sample, we take our CARS.csv file, shipped with a couple of our FNC demos. The file contains a list of cars, with useful info such as the power, cylinder capacity and price. First of all, we load our csv data in a TTMSFNCGrid.
TMSFNCGrid1.IOOffset := Point(1,1);
TMSFNCGrid1.LoadFromCSV('CARS.CSV');
TMSFNCGrid1.SortData(1, sdAscending);
TMSFNCGrid1.Cells[1,0] := 'Brand';
TMSFNCGrid1.Cells[2,0] := 'Type';
TMSFNCGrid1.Cells[3,0] := 'CC';
TMSFNCGrid1.Cells[4,0] := 'Hp';
TMSFNCGrid1.Cells[5,0] := 'Cyl';
TMSFNCGrid1.Cells[6,0] := 'Kw';
TMSFNCGrid1.Cells[7,0] := 'Price';
TMSFNCGrid1.Cells[8,0] := 'Country';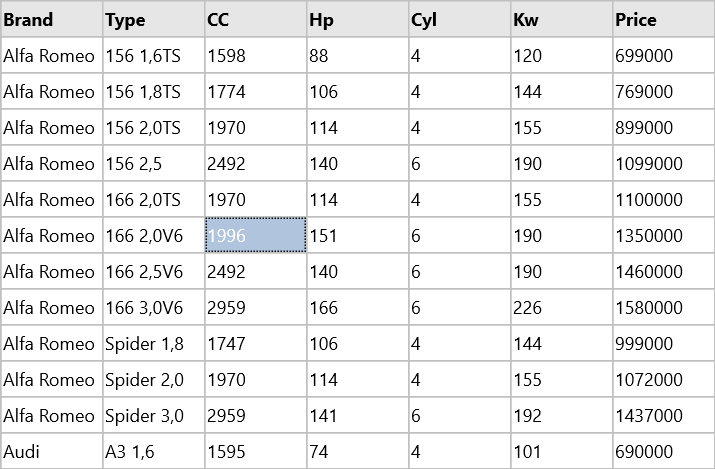
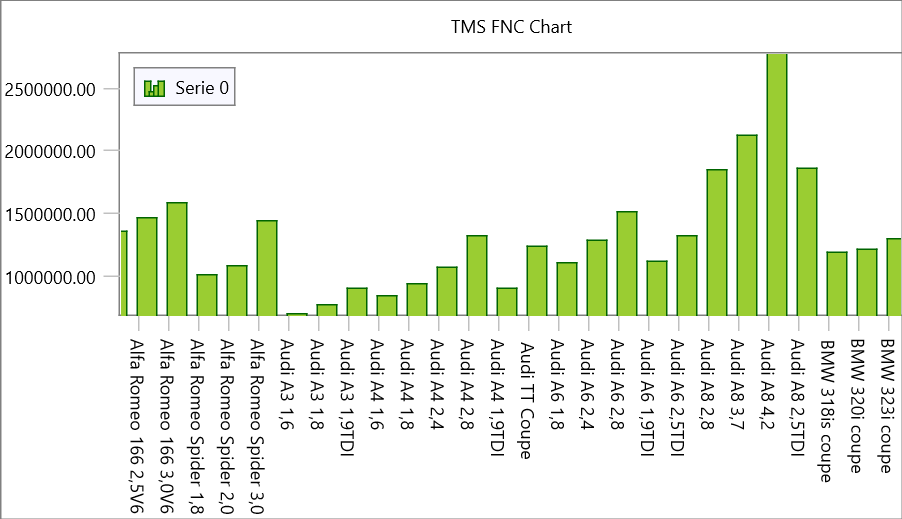
var
  s: TTMSFNCChartSerie;
begin
  TMSFNCChart1.Series.Clear;
  s := TMSFNCChart1.Series.Add;
  s.ChartType := ctBar;
  s.XValues.Angle := 90;
end;
procedure TForm1.TMSFNCChart1GetNumberOfPoints(Sender: TObject;
  ASerie: TTMSFNCChartSerie; var ANumberOfPoints: Integer);
begin
  ANumberOfPoints := TMSFNCGrid1.RowCount - 1;
end;
procedure TForm1.TMSFNCChart1GetPoint(Sender: TObject;
  ASerie: TTMSFNCChartSerie; AIndex: Integer;
  var APoint: TTMSFNCChartPointVirtual);
var
  v: Integer;
begin
  v := 0;
  if TryStrToInt(TMSFNCGrid1.Cells[7, AIndex + 1], v) then
    APoint.YValue := v;

  APoint.XValueText := TMSFNCGrid1.Cells[1, AIndex + 1] + ' ' + TMSFNCGrid1.Cells[2, AIndex + 1];
end;
v2.0
Our team is working hard on the next version which will include a significant amount of new features and improvements related to data import, look & feel and out of the box experience. Stay tuned for more! Want to explore the capabilities of TMS FNC Chart, go ahead and download it from our product page.
Pieter Scheldeman
Bookmarks:

This blog post has not received any comments yet.
All Blog Posts | Next Post | Previous Post