
In this previous post, I spoke about writing a debugger. This one will talk about the formats a debugger needs to be able to read. For our debugger we settled on using DWARF debug info everywhere, as this is the most common debug format on POSIX, and works well enough on Windows too.
File Formats
As seen in the previous article, debuggers get notified of module loading, however when a module is loaded, the first step is keeping track of where it's loaded to (the load address), gathering the module symbols and, if available, the debug information. Unfortunately, each platform has it's own executable format, and the situation on Apple's platform is a little more complex:
| OS | Format |
|---|---|
| iOS/macOS | Mach-O Universal executable, this is a format that contains more than 1 executable Mach-O executable,for each supported CPU and CPU subtype (for example, x86_64, arm64, arm64h) |
| iOS/macOS | Mach-O File format, this is the default executable format on macOS, used for both objects and executables. Executables on macOS don't generally contain debug info, instead they contain references to the object file they were compiled from, which will have the debug info, if still present |
| Posix (Linux, BSD, Android) | The ELF File format is used here, this format is straight to the point, and will contain debug info inside the executable (merged from the original object files) |
| Windows | PE/COFF The PE format is used for executables, while the COFF format is used for object files, their structure closely matches |
While the formats are quite different, all of them contain simialar info: what CPU architecture they run on, a list of sections containing code, data and debug information. Properly abstracted these can be seen as the same thing on a higher level. Note that not all platforms map the full file in memory, often sections are discarded before loading, so there is some mapping needed by debugger to know which section actually is located where. The loading code in the debugger should handle this.
DWARF
Dwarf is spread over multiple sections but these are the most important ones:
| Section | Description |
|---|---|
| __debug_info/.debug_info | Holds the actual debug info, can contain multiple entries, as lots of linkers just concat this after eachother |
| __debug_line/.debug_line | Contains the line info table |
| __debug_abbrev/.debug_abbrev | Contains information on how debug info is encoded. This is required to be able to read the debug info |
Debug Info
Debug info consists of one or more debug info records, called a "compile unit". They start with a length, version, address size and abbreviation offset. These don't have to match between the different versions. After reading the header, the abbreviation table has to be read to find out how the rest of the debug info is formatted.
Most of DWARF is encoded with SLEB/ULEB128 encoding. Both of these encodings use 7 bit variable sized integers, and use the top bit to say there's another byte of data. The big difference between SLEB and ULEB is that SLEB is used to write signed integers efficiently. For the last byte when the top bit is not set, the 6th bit is used to say if a value is negative.
Abbreviation Table
The abbreviation table is a table that maps a code to a list of fields and their encoding. It starts with the code, as ULEB128, then 1 or 0 if it has child nodes, then a list of fields, which consists of an ULEB128 attribute name, and a ULEB128 type that defines their encoding. The rest of the debug info records reference this table by code, and that way it defines what is actuallly stored in it, an efficient way to define the structure only once.
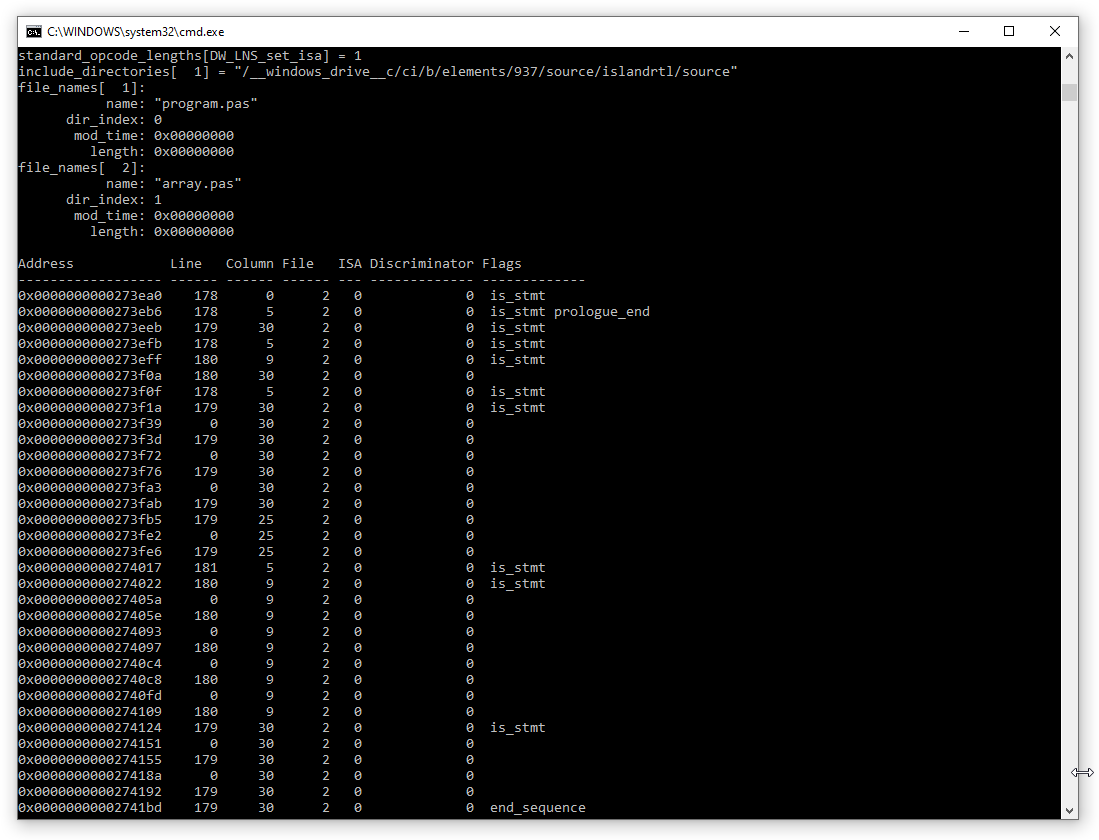
Line Info
The line info table is referenced from the main CompileUnit record. There can be multiple of these records, one per compile unit. The line table is highly optimized in storage, the header defines how long the smallest opcode is, the default opcode lengths and the first line. The rest of the line info contains a list of opcodes to advance a line, advance one or more instructions, change the file and to actually create a line info record. Once decoded, it contains a list of filename, row, column, instruction address, and flags (which also can contain hints for the debugger, such as IsStatement, EndOfSequence, Prologue begin/end.
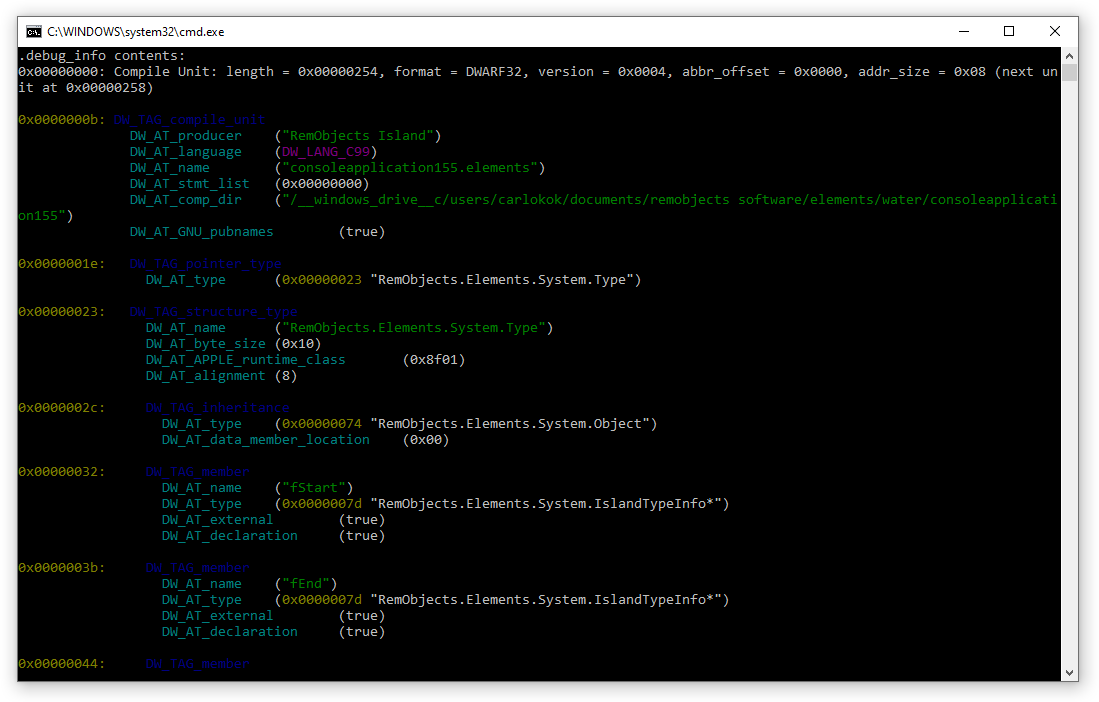
Reading the Main Debug Info
After reading the abbreviation table, DWARF can be read sequentially by reading the abbreviation code, and based on the code and it's fields, the data in it. If an abbreviation is defined as having children, the sub-records are read (which can have sub-records of their own). The end result is a one or more trees of data, where the root is always a compile unit.
Reading a record is done by iterating the abbreviation fields. For each entry, the type (called FORM by DWARF) defines how it's written, for example DW_FORM_addr is written as 4 or 8 bytes (depending on the address size in the header). DW_FORM_udata is an ULEB128 field. There are lots of different field types that are possible here, each with their own way of writing and decyphering meaning. The attribute name of the abbreviation maps to what the meaning of that field is. Attributes that are not known should be skipped, based on their type (FORM).
The compile unit has several possible values of interest, for example the language, which is a code defining the source language. The stmt_list referring to the line info table, the low/high pc containing the address range the code for this compile unit is defined in.
Inside the compile unit, different things can be found, like namespaces (think C++ namespaces), sub programs (functions), variabes, and types. Types can also have further members and sub programs
Sub programs generally consist of a nice name, a linker name, a low/high address to map code back and forth, often also a list of lexical scopes, inline sub functions, local variables and parameters. Variables and parameters are define as a sequence of "instructions". In their most basic form, used when running not optimized, they can be as simple as "read framepointer", "add/sub number", "dereference". When optimized, they can be unavailable, in a register, or really anywhere.
Debuggers should generally maintain a set of indexes of where to find what method for easy access, and to map line info to a method instruction and back.
Putting it together
After reading the debug information, the debugger can use the lowpc/highpc of sub programs to figure out the current stack frame, and, together with the stack walking in the previous blog post, build the whole stack trace. The line information inside the compile units can be used to allow setting line breakpoints, stepping in (which is done by stepping single instructions until the line information changes), stepping out (which is done by setting a breakpoint on the return address), and stepping over (by combining the both).
When the basis above is covered, we can get:
- The current line/column for a runtime position (line info table, module load information)
- The runtime position for a line/column, for setting breakpoins
- The current scope for a method, which defines which locals are actually available currently. Scopes can be nested.
- The locals available at that line
- The type information for locals, which has information on what sub-fields are available, and their types
Evaluating Expressions
With all the information we have now we can get the locals, arguments (where self/this is also an argument), but what's missing is that in most cases, we want the string represenation of a type, not the raw values.
Runtime evaluation and calls are a bit trickier. Calling a method at runtime requires that we save the current registers and state, push the new parameters on the stack, call the function and wait for it to finish or fail.
An additional tricky bit here is that an exception might occur, either as a panic or a regular one, and we want that one to be captured but not influence the original application. We solved this by generating some code on the fly to call a method, like this:
struct ArgList {
  int status;
  void* exception;
  void* return; // only when there is one
  arg1, arg2
}
void $CallMethod(arglist: ^ArgList)
{
  try {
    arglist->status = 1;
    arglist->return = RealMethodCall(arglist->arg1, arglist->arg2);
    arglist->status = 3;
  } catch(Exception e) {
    arglist->exception = e;
    arglist->status = 2;
  }
  trap;
}
The goal of this stub, that we compile with LLVM, is that it takes care of all nuances of argument passing and that it takes care of exception handling, additionally it traps at the end and we can easily catch that to know when evaluation is done.
This does introduce some issues. All we get from LLVM is an object file, which means we needed three object file loaders (ELF, Mach-O and COFF), that load the compiled code into the target process, relocate all unknown symbols, and cache this. We also needed to be able to allocate memory in the target process, which is relatively easy: on Windows the VirtualAllocEx API allows for this, and the GDB protocol on iOS/macOS also has an API for this. When all else fails, we call mmap directly to allocate executable memory.
When we do have this function loaded we call it, wait for the trap, and restore the original registers. Alternatively, if it times out we do the same but return an error to the user.
Conclusion
That's pretty much it, all that's needed to write a debugger.
